
Solar radiation refers to energy produced by the Sun, some of which reaches the Earth. This is the primary energy source for most processes in the atmosphere, hydrosphere, and biosphere. In the context of current global change, over the last 40 years scientists have measured slight fluctuations in the amount of energy released by the Sun and have found that global warming today is not caused by changes in the amount of energy coming from the Sun.
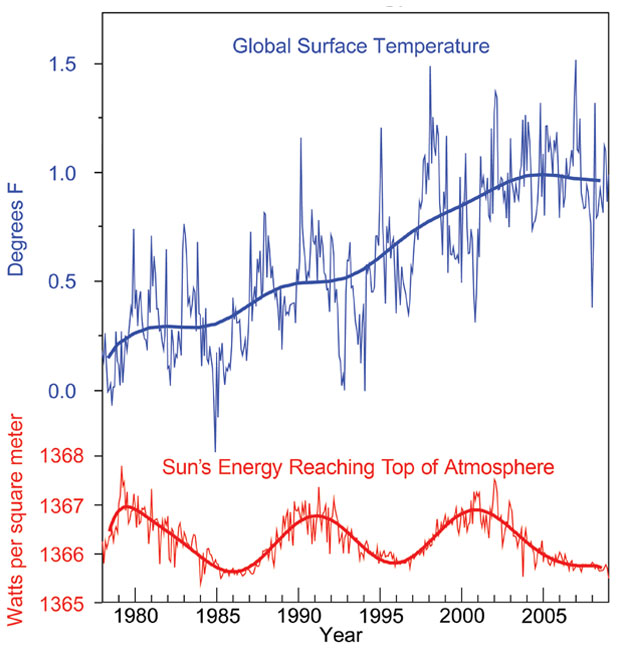
Changes in the amount of the Sun’s energy reaching Earth (specifically the top of the atmosphere) are not causing the increase in Earth’s average surface temperature. Source: Global Climate Change Impacts in the United States, Thomas R. Karl, Jerry M. Melillo, and Thomas C. Peterson, (eds.). Cambridge University Press, 2009.
The amount of energy released by the Sun changes slightly, by approximately 0.1%, every nine to eleven years, diagrammed in the red bottom graph to the right. However, these cycles are not the cause of the current global warming trend, shown in the top blue graph to the right, which is the result of increases in greenhouses gases in the atmosphere.
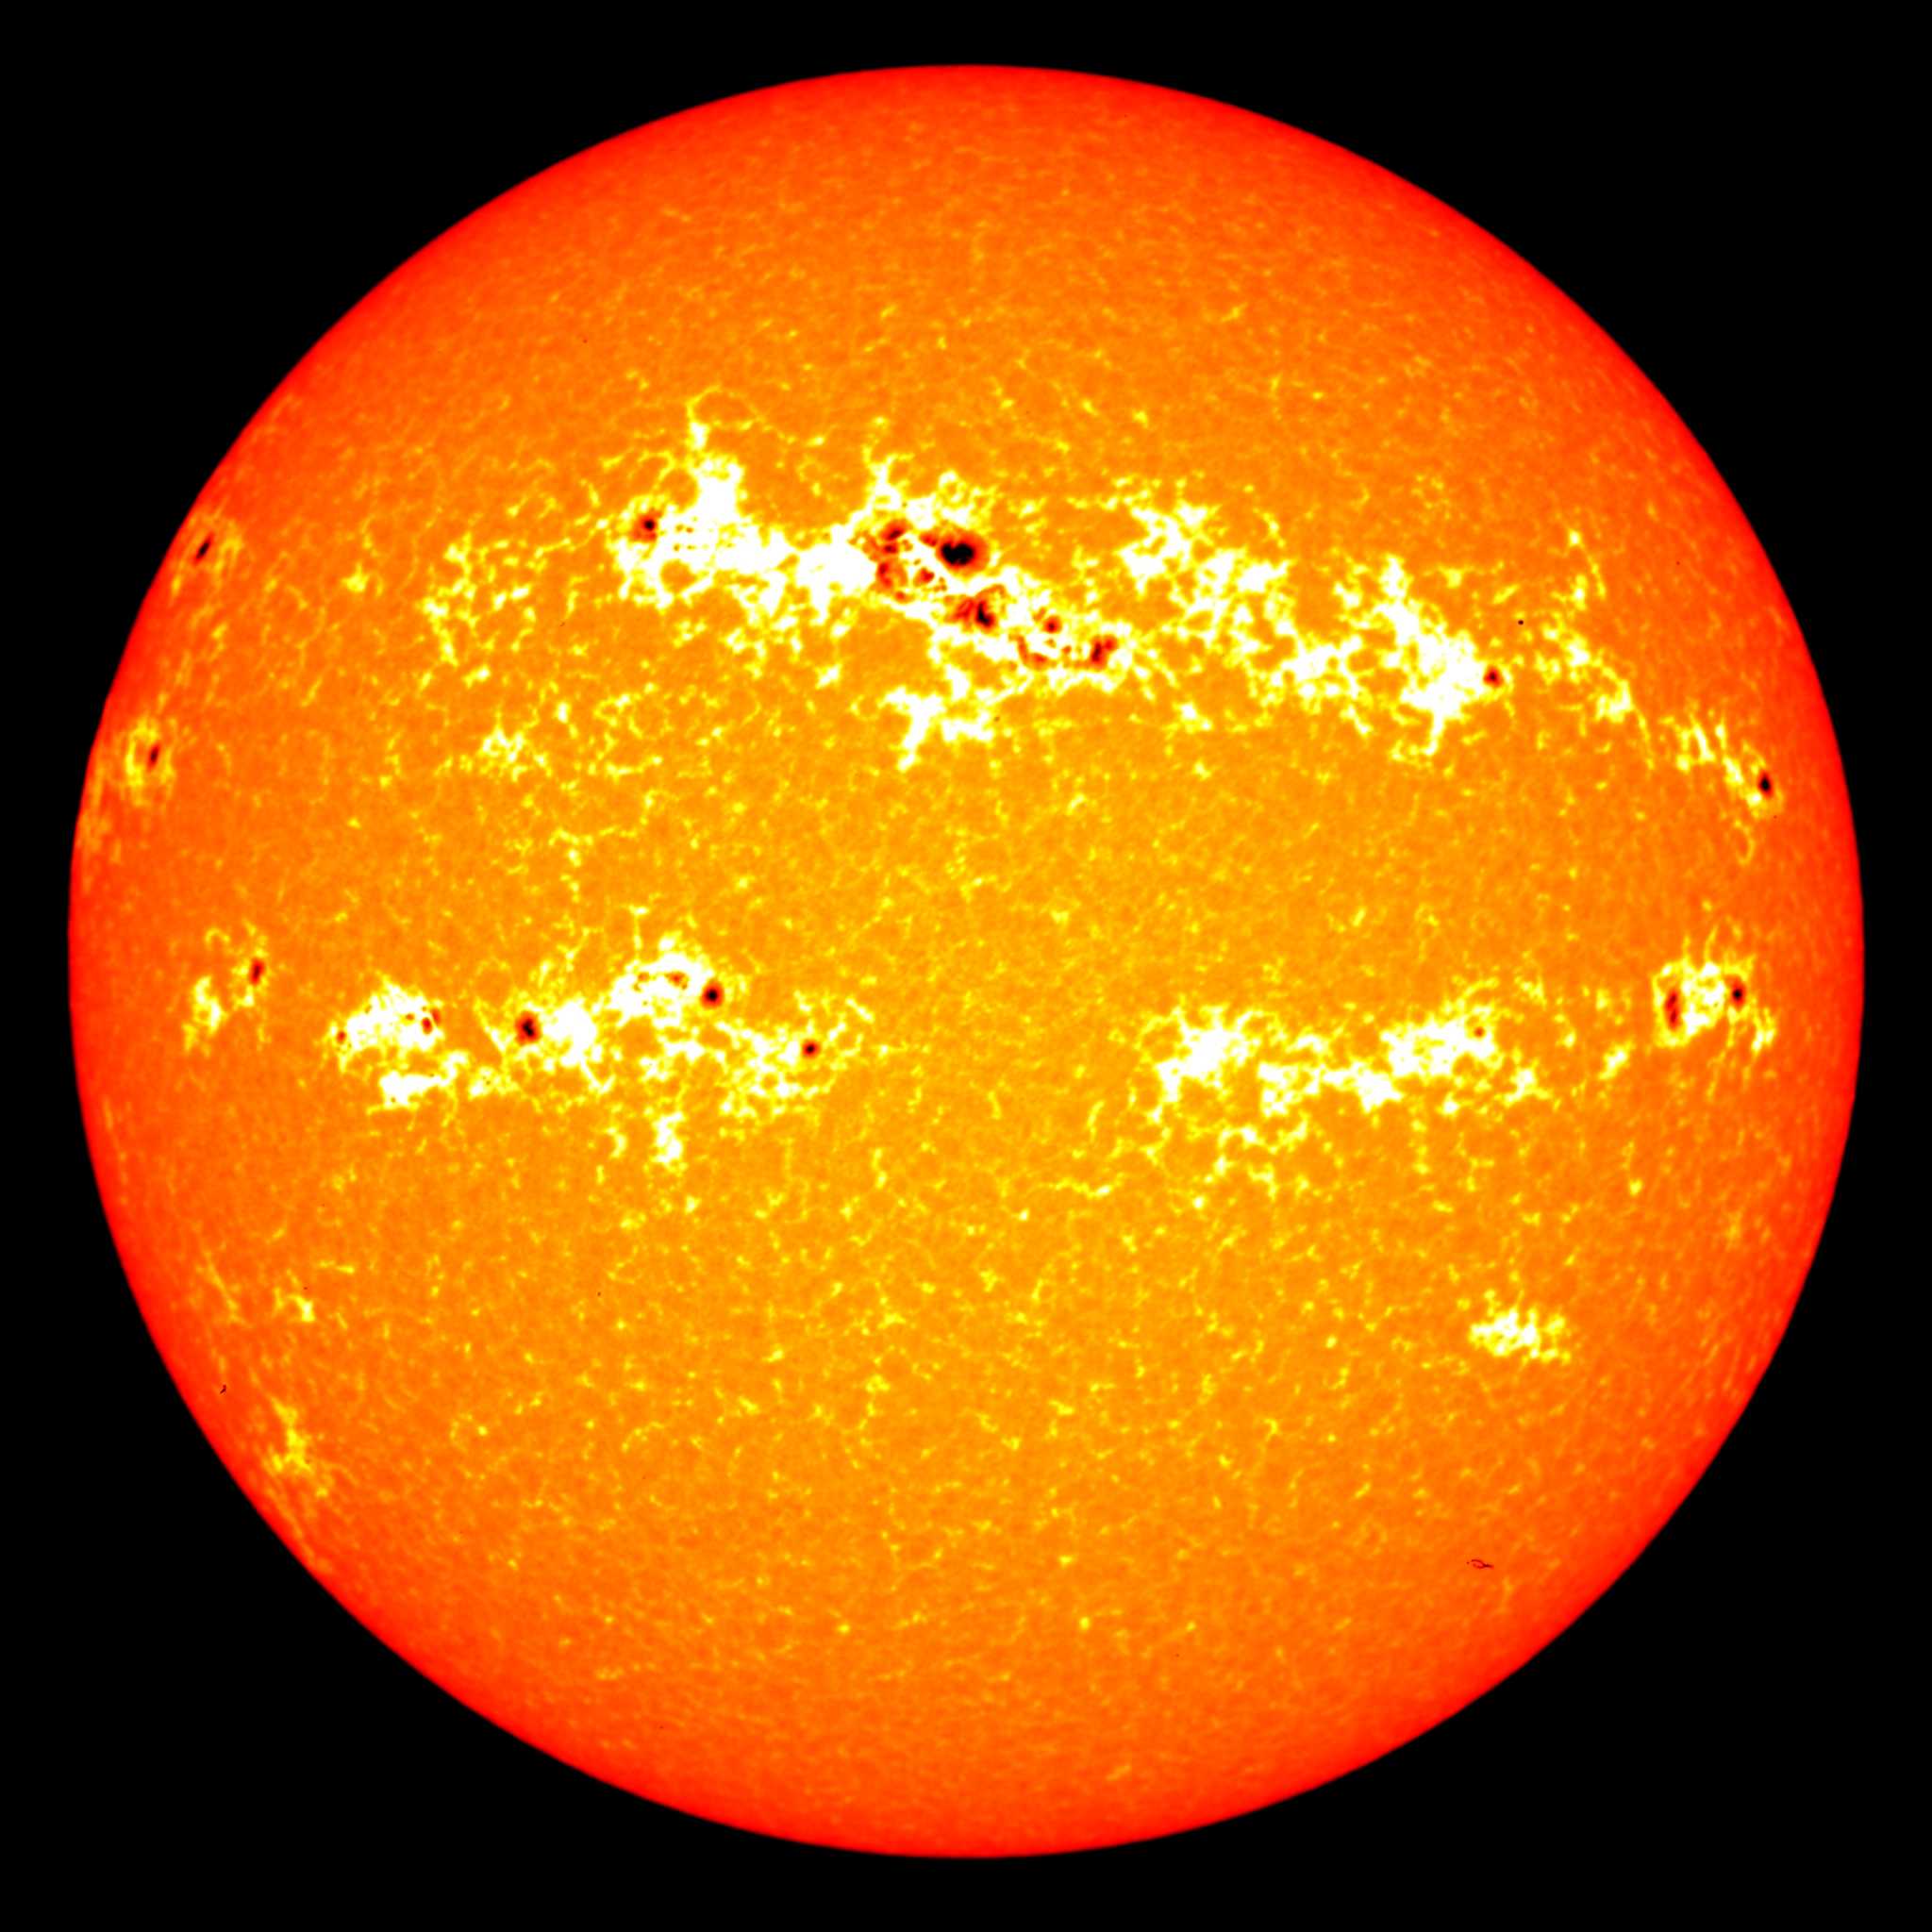
Sunspots and fasculae on the surface of the Sun. Credits: NASA/Goddard/SORCE
However, changes in solar output may have affected the climate from the mid 1600s to early 1700s in northern Europe during a cold period called the Little Ice Age. This corresponds to a time of reduced sunspot activity, called the Maunder Minimum (see graph below). While sunspots themselves are areas of the Sun that temporarily release less light, they usually form alongside brighter areas of the Sun, called faculae, which release more light. During times of decreased sunspots (and less faculae) there is a slight decrease in the amount of energy released by the Sun.
See Earth’s spin, tilt and orbit for a description of how changes in the amount and distribution of solar energy received by the Earth affects the climate on longer timescales.
Changes in solar radiation have likely affected the Earth system in the past on various scales. Some of these ways include:
- Increasing or decreasing amount of sunlight that is absorbed by the surface of the Earth. This can affect Earth’s average temperature.
- Increasing or decreasing temperatures, which can alter the distribution of snow and ice cover.
- The growth of photosynthesizing organisms, and in turn, affects the productivity and biomass in ecosystems.
Visit the Earth’s spin, tilt, & orbit, absorption/ reflection of sunlight and re-radiation of heat pages to learn more about how solar radiation influences Earth’s energy budget.
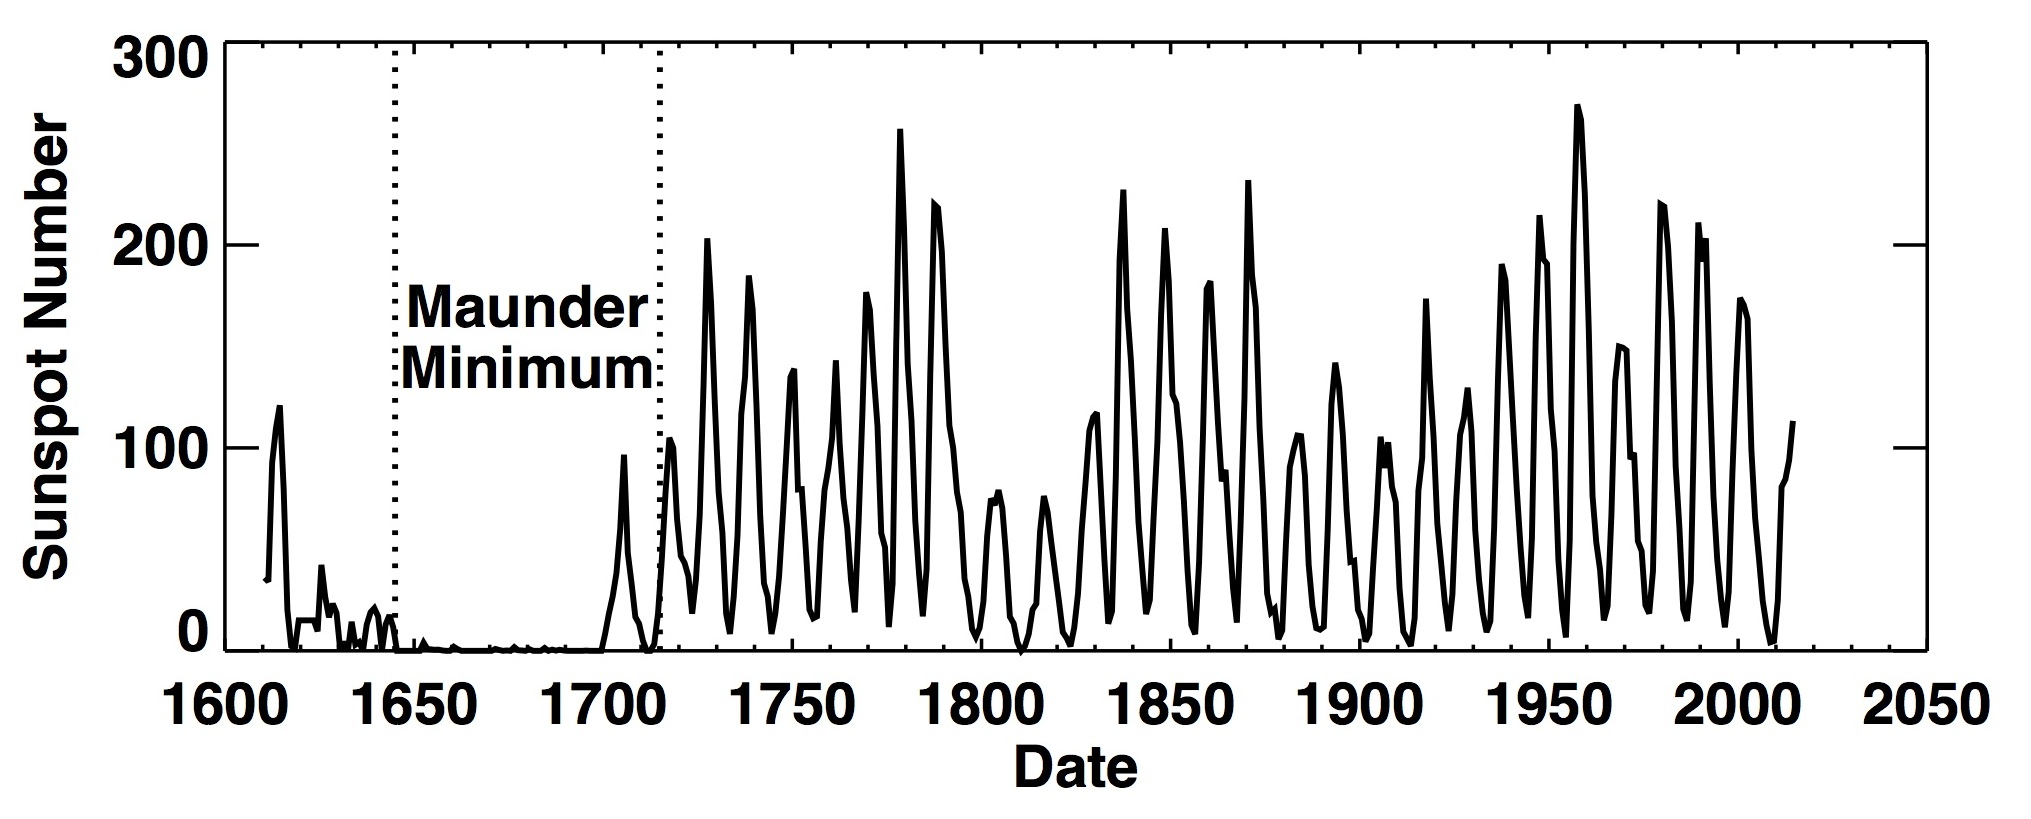
The number of sunspots observed by astronomers over the last 400 years. Source: NASA
Investigate
Learn more in these real-world examples, and challenge yourself to construct a model that explains the Earth system relationships.
Links to Learn More
- Climate.gov Climate Change: Incoming Sunlight
- NASA Earth Observatory: Sunspots at Solar Maximum and Minimum
- NASA: Solar Cycle Primer
- NASA: Is the Sun causing global warming?
- NASA: Why NASA keeps a close eye on the Sun’s irradiance
- NASA: The Sunspot Cycle
- NASA Earth Observatory: Chilly Temperatures during the Maunder Minimum