Educators, go to the Teaching Resources page after you have finished viewing the slide show below.
The goal of this website is to provide a broad yet approachable introduction to global change processes and the causes of environmental and climate change. If you are interested in global change, or are teaching science, this site is for you. With this site you can build your own models about global change, starting with whatever aspect of the world you are interested in, or that is relevant to your community. This website will also help you think about your place in the world — what affects your life and how you influence other parts of the Earth — and how we can solve local and global climate and environmental problems. In the following slides we introduce you to our Understanding Global Change Framework and Infographic, followed by an example sea level rise model.
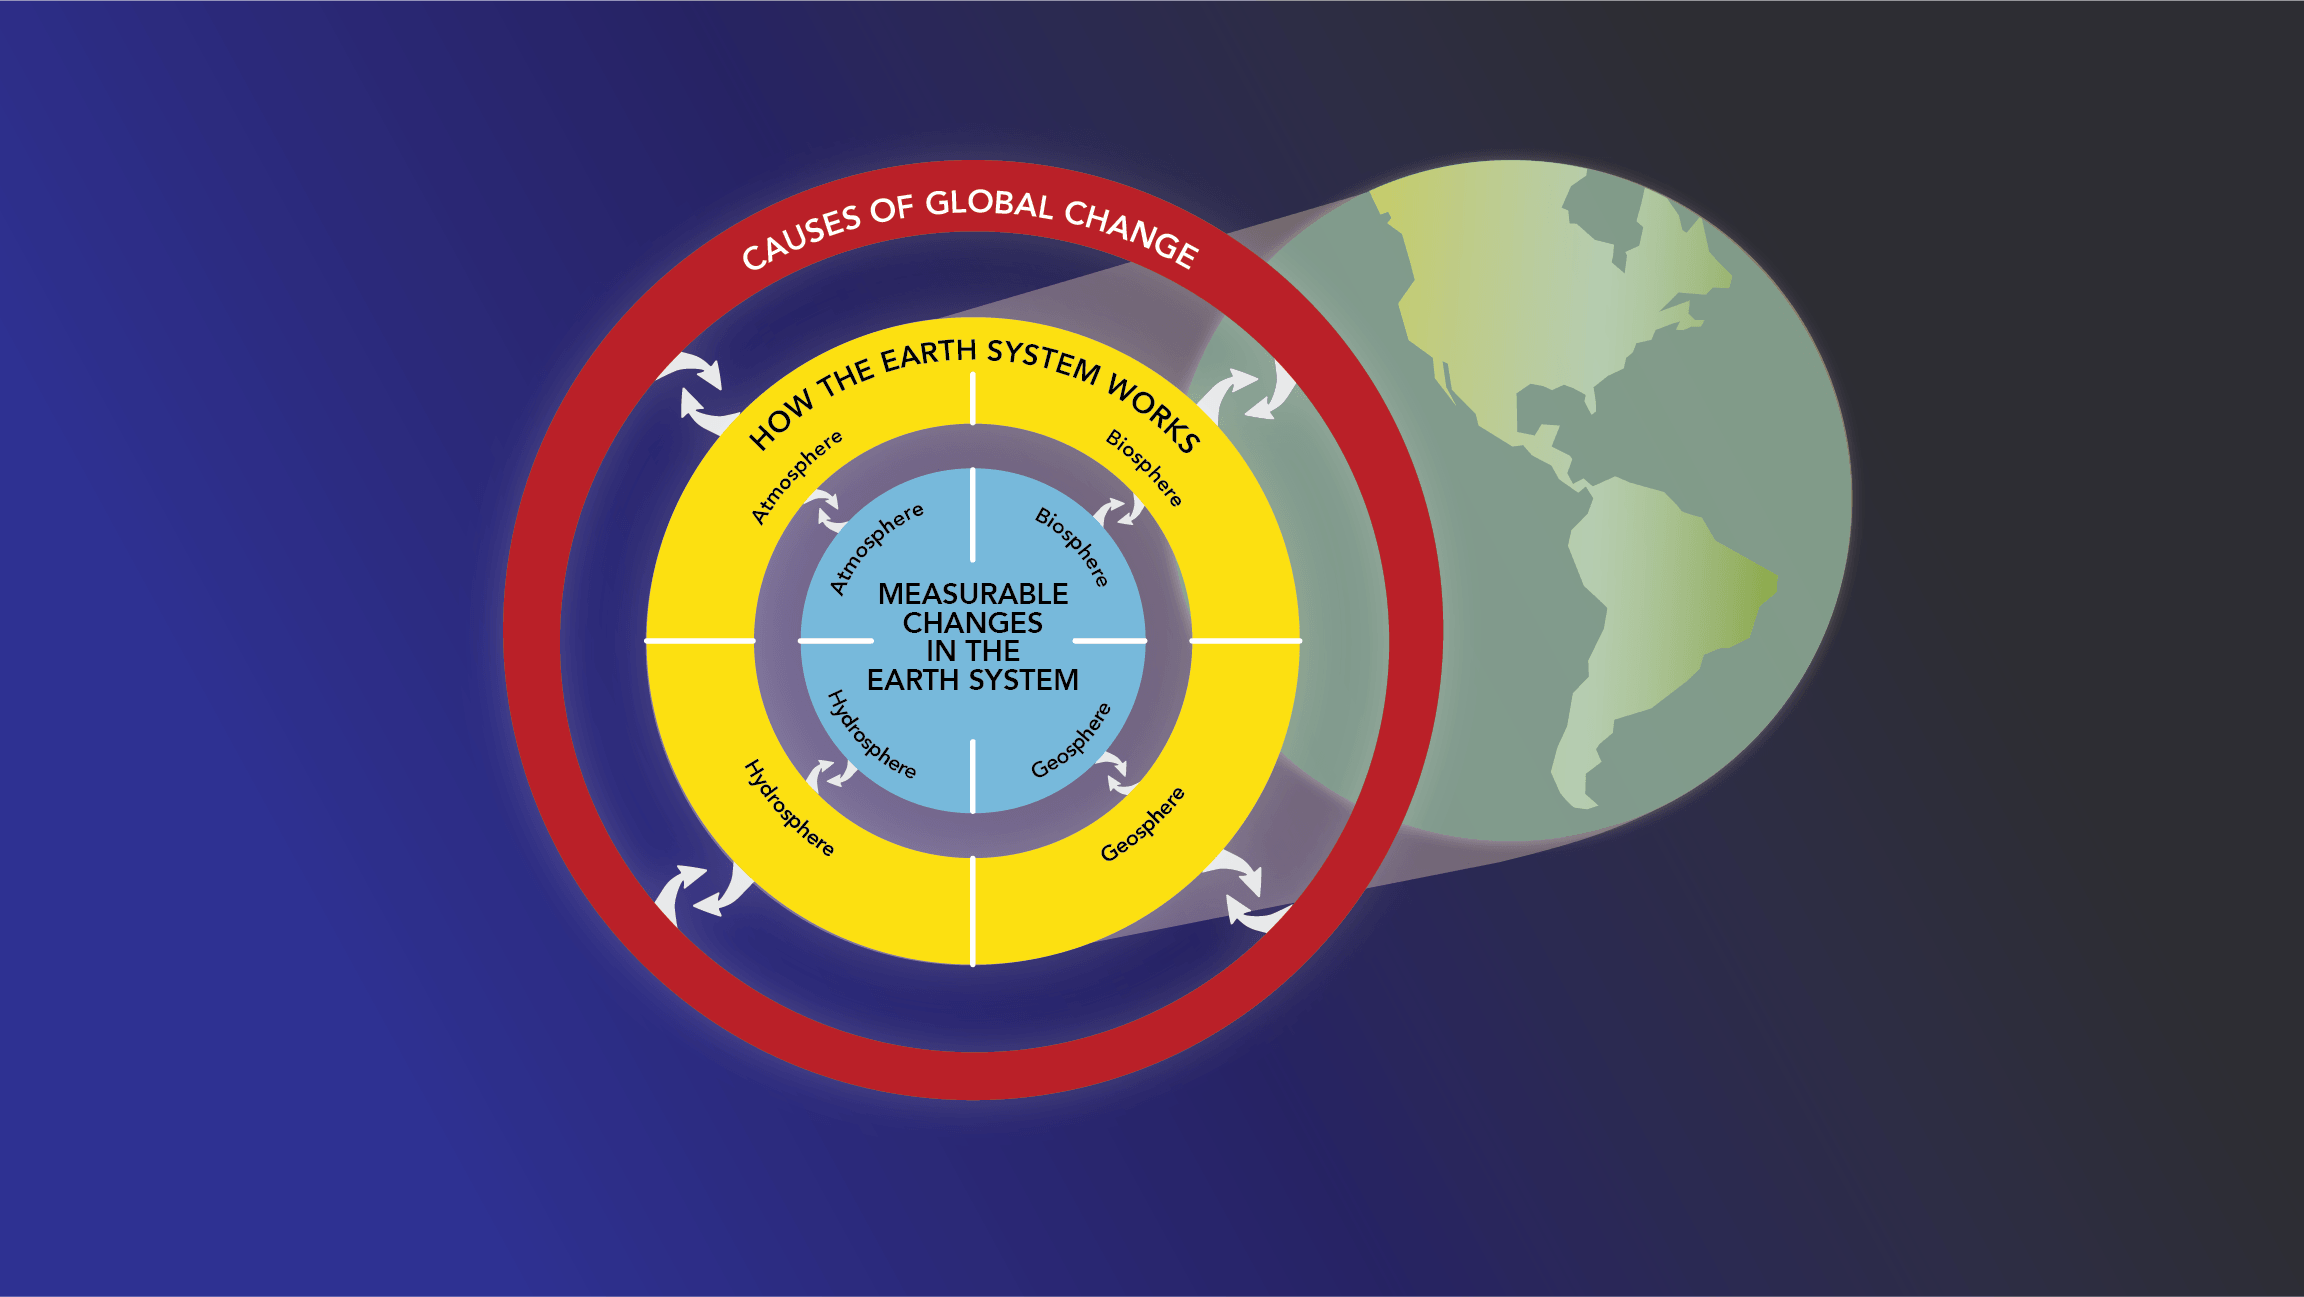
The UGC Framework: This website is organized using a three-part framework to illustrate how the different parts of the Earth interact as a system to cause environmental and climate change. The outer part of the framework consists of the CAUSES OF GLOBAL CHANGE, which are both human and non-human, that result in environmental and climate change. The central portion of the framework contains the interconnected processes that describeHOW THE EARTH SYSTEM WORKS. These processes shape how the Earth system responds to changes through time. The inner part of the framework contains the MEASURABLE CHANGES IN THE EARTH SYSTEM that occur as the Earth system responds to the causes of change.
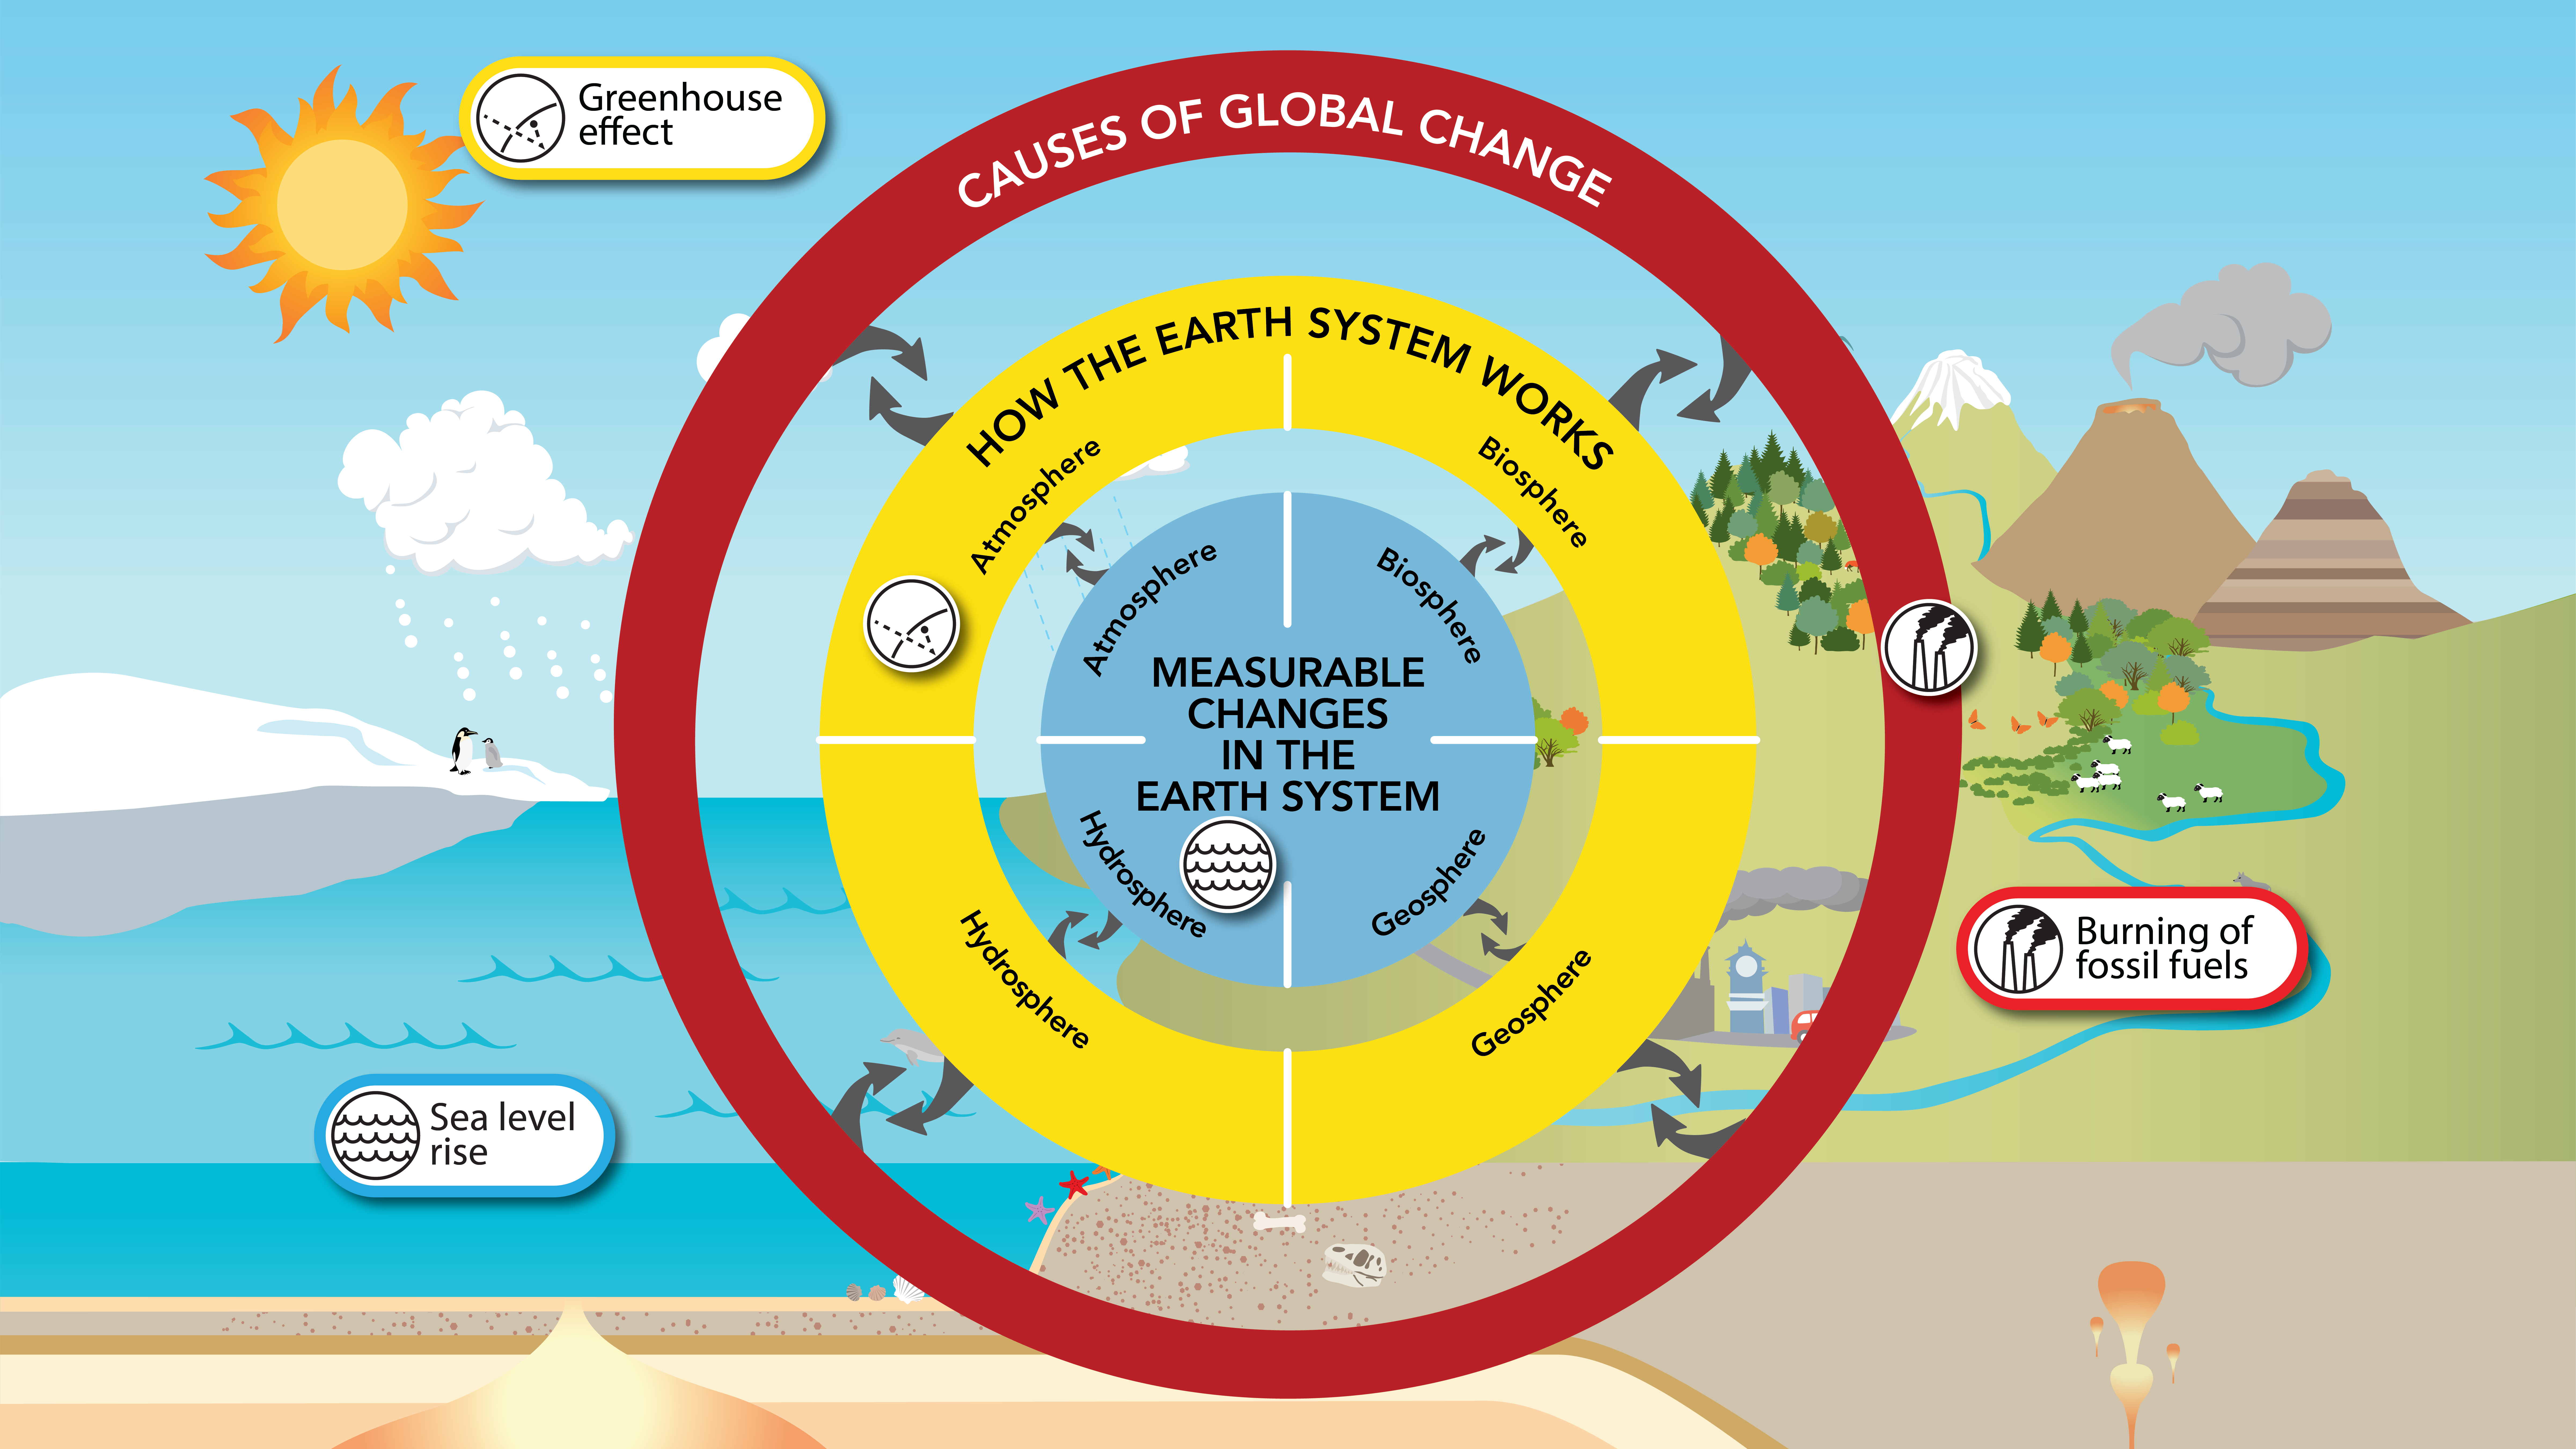
On our Framework, key global change processes and phenomena are represented by icons. The icons are each assigned to their appropriate part of the framework. For example, the Burning of fossil fuels (represented by the icon ![]() ) is a Cause of Global Change, the Greenhouse effect is a part of How the Earth System Works, and Sea level rise is a Measurable Change. In the graphic below, these three icons have been placed on the appropriate part of the Framework and on the Earth Scene. Because climate and environmental change is complex and influenced by many factors, there are many more icons in the Framework than just these three. We call the Framework with the icons the UGC Infographic.
) is a Cause of Global Change, the Greenhouse effect is a part of How the Earth System Works, and Sea level rise is a Measurable Change. In the graphic below, these three icons have been placed on the appropriate part of the Framework and on the Earth Scene. Because climate and environmental change is complex and influenced by many factors, there are many more icons in the Framework than just these three. We call the Framework with the icons the UGC Infographic.
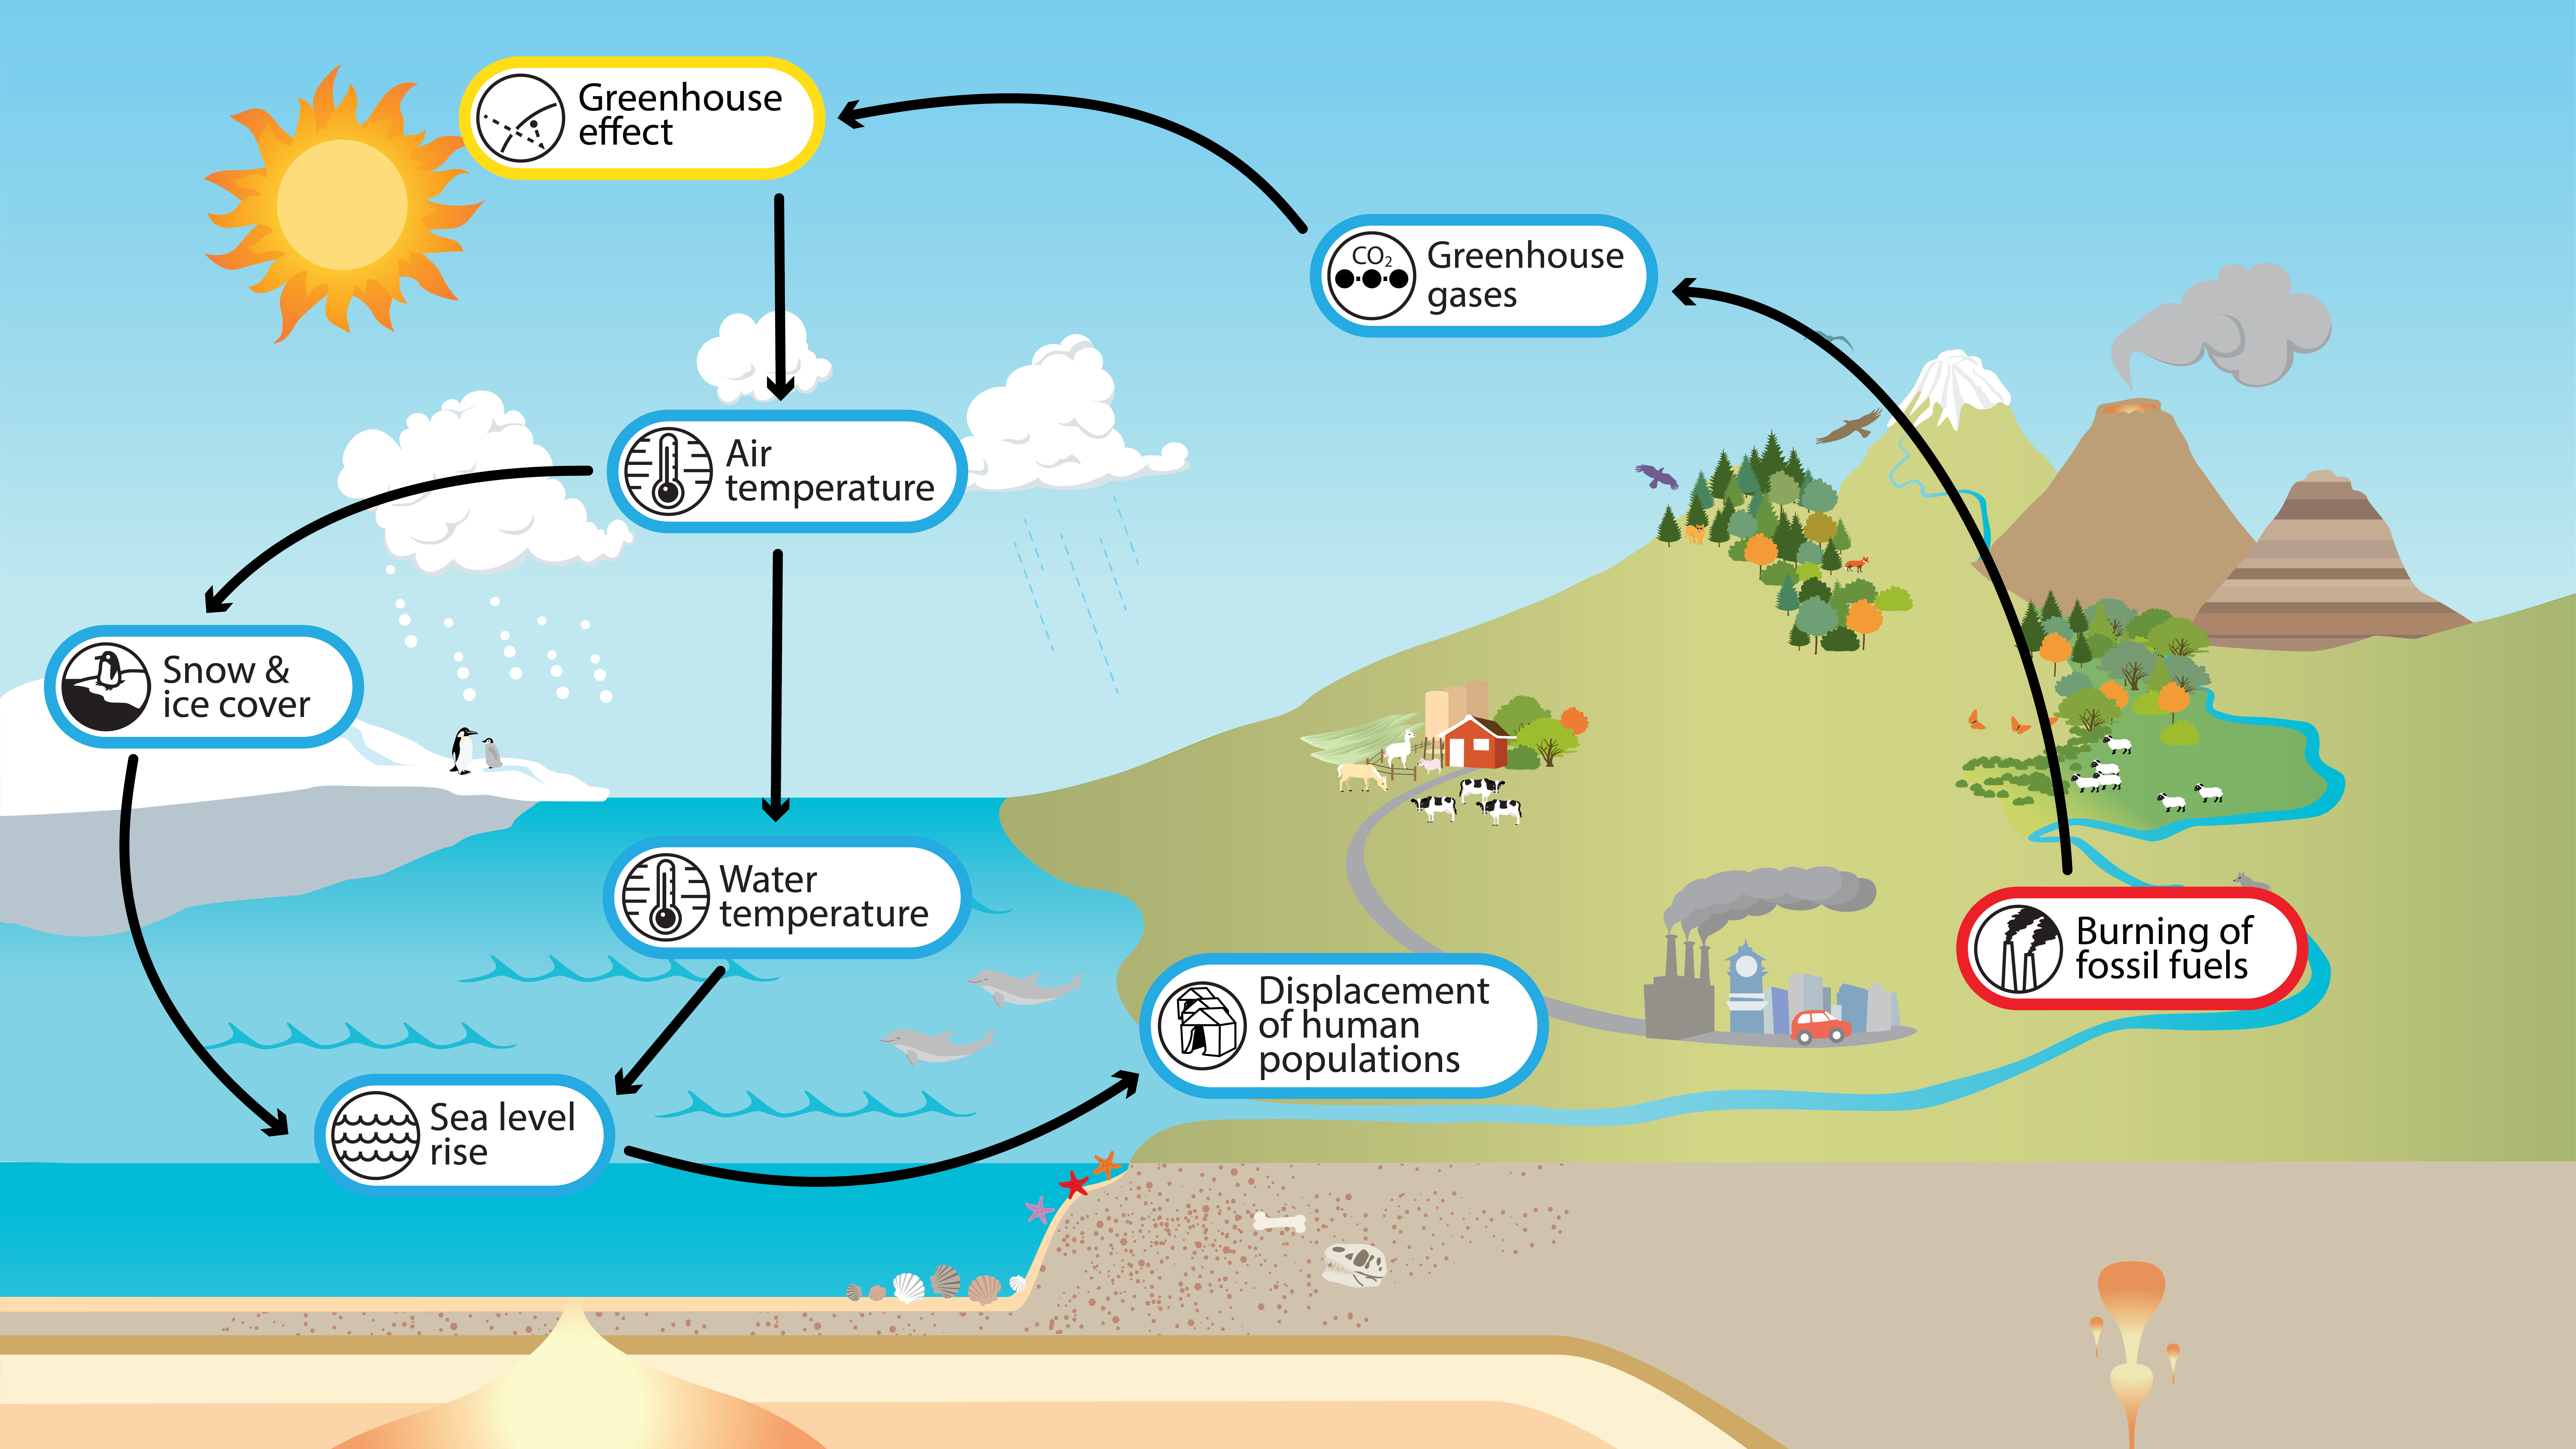
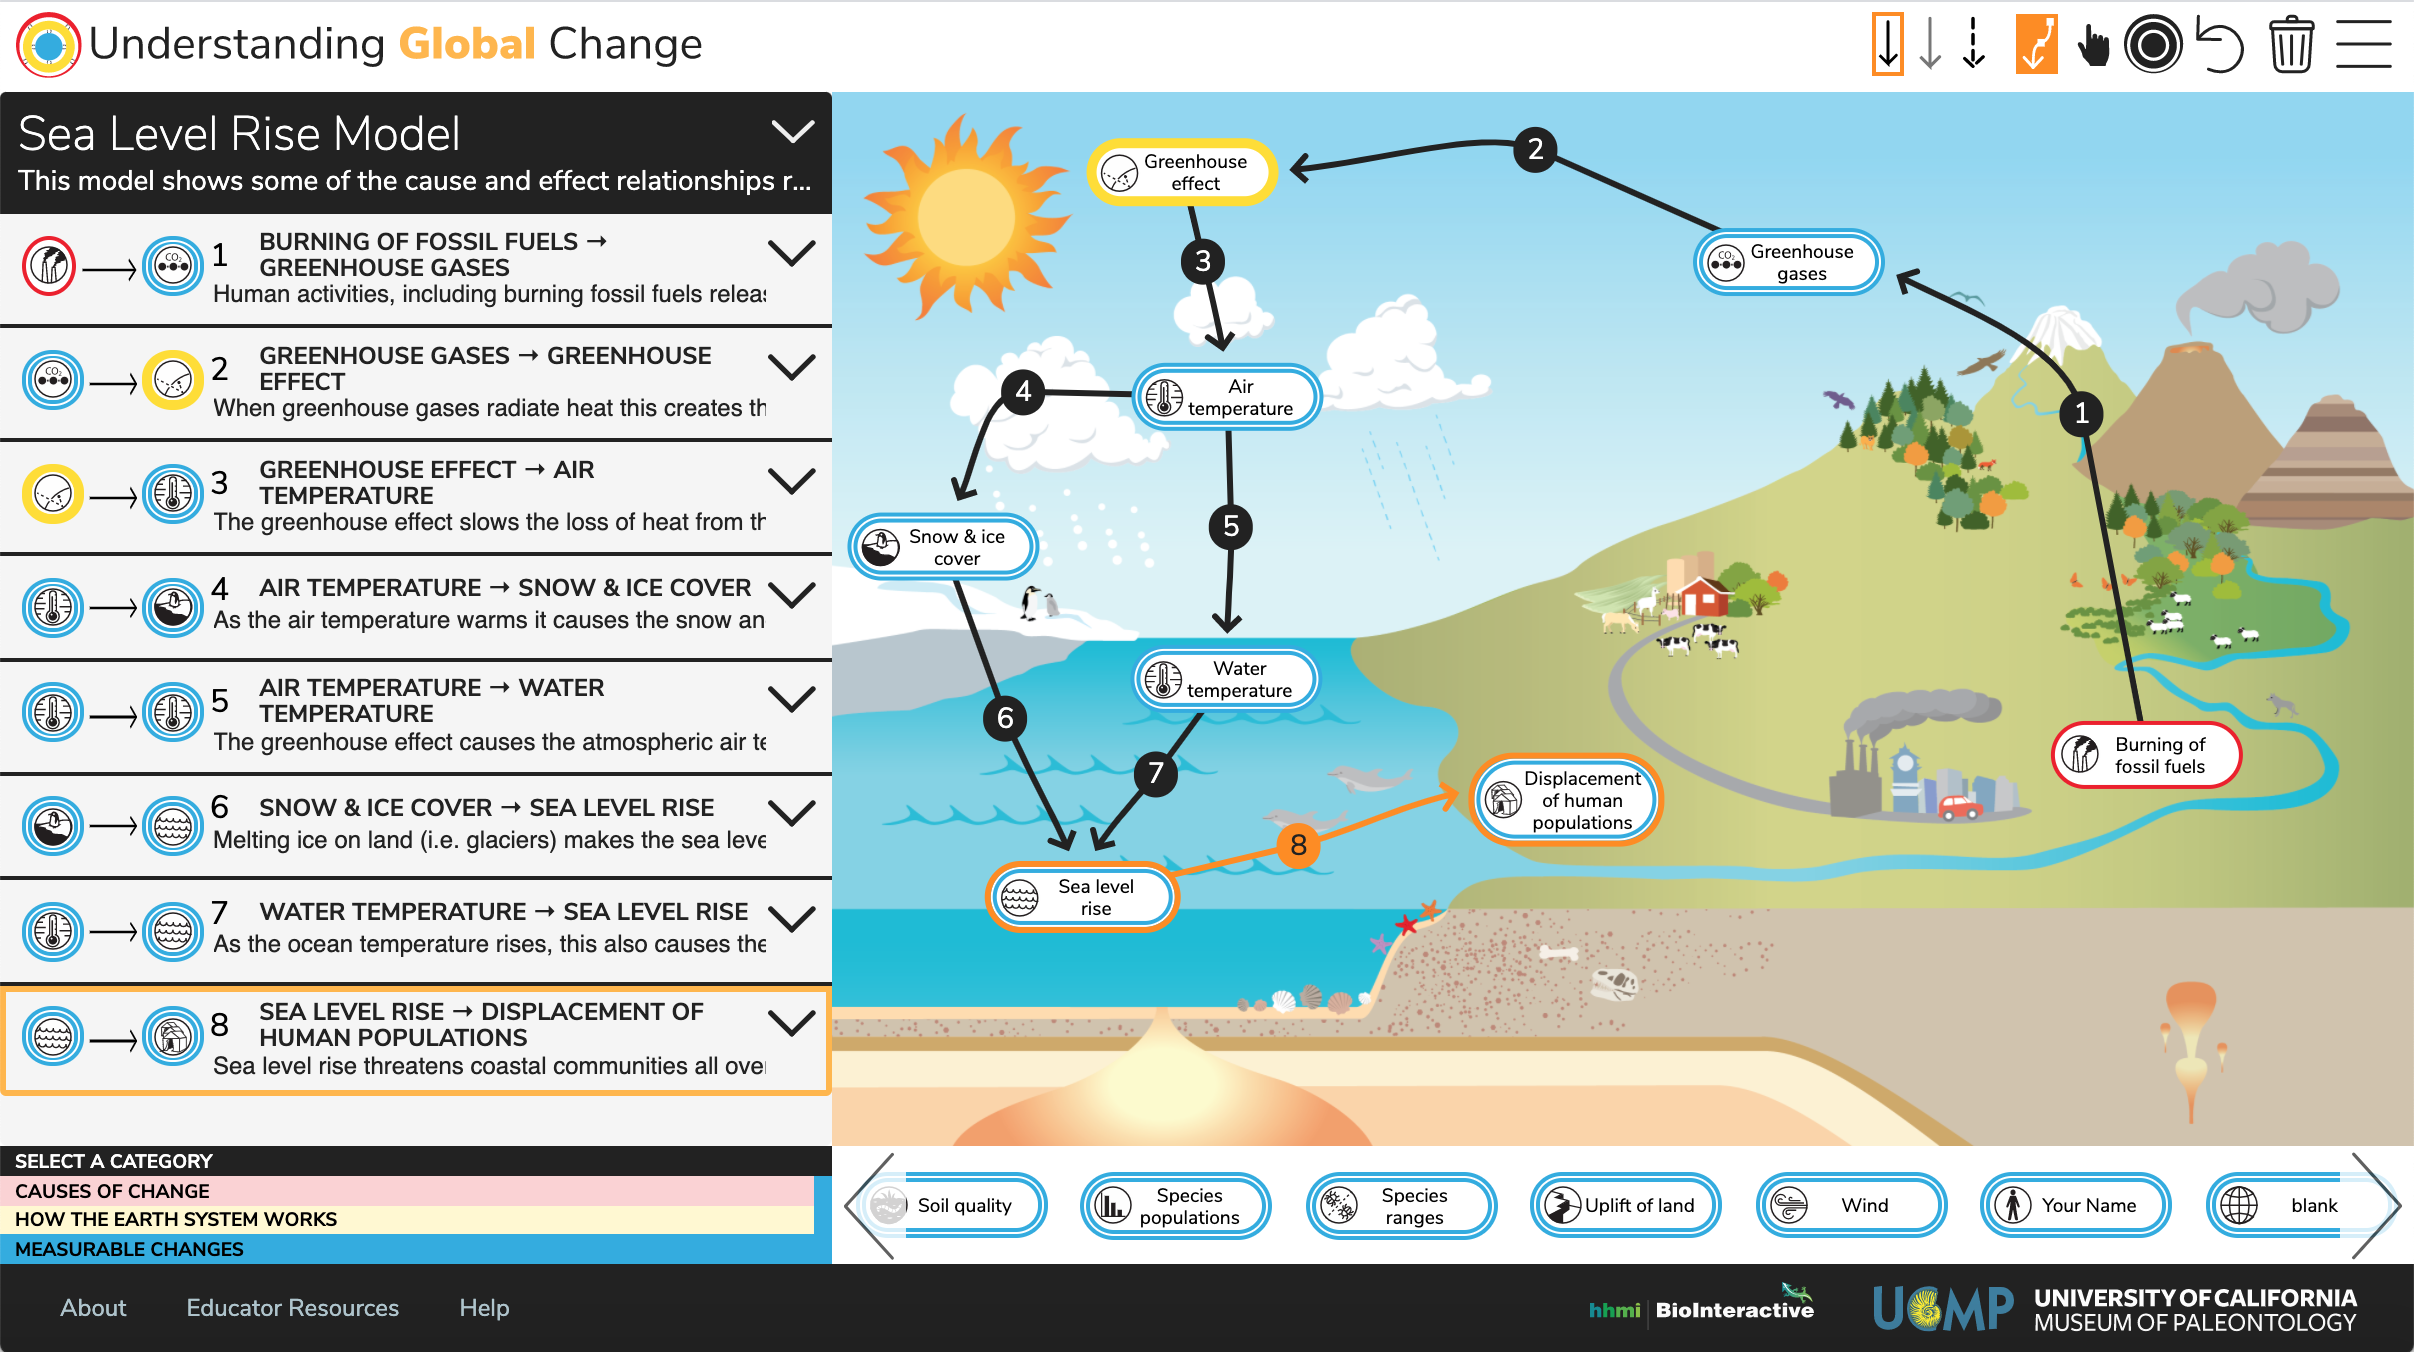
Using the Understanding Global Change icons, we can visualize the web of cause and effect relationships in the Earth system that result in global change. Below is a model explaining some of the cause and effect relationships relevant to sea level rise. An important cause of sea level rise is the burning of fossil fuels, which releases greenhouse gases into the atmosphere, and through the greenhouse effect increases average global air temperatures. In turn, the higher air temperatures increase the melting rate of glaciers and ice caps (decreasing snow & ice cover), and the melted water contributes to sea level rise. The arrows show how these processes and phenomena are connected. We also included an icon to capture one of the consequences of sea level rise, the displace human populations around the world. As you build your own models, you can challenge yourself and your students to think of additional connections not represented in this or other models on the website.
How to construct your own models using the UGC icons and framework. You can make your own models using the UGC Interactive, co-designed with HHMI BioInteractive (see Construct a Model on the navigation bar). Below is the sea level rise model from the previous page constructed in the interactive. The UGC Interactive allows you to save, edit, and export Earth system models and explanations into PowerPoint files. This resource will help you to visualize cause and effect relationships, and explain the environmental changes that are happening in your neighborhood and around the world.
To learn more, visit the Understanding Global Change 101 page for a guided tour of the fundamental Earth system processes relevant to environmental and climate change. Continue your exploration of specific processes and phenomena portrayed on the Understanding Global Change Infographic by visiting the How the Earth System Works, Causes of Global Change, and Measurable Changes pages. The How the Earth System Works pages also provide example system models constructed using our icons and Earth Scene. Please join us on this quest to understand how interacting processes and phenomena shape our ever-changing world.
