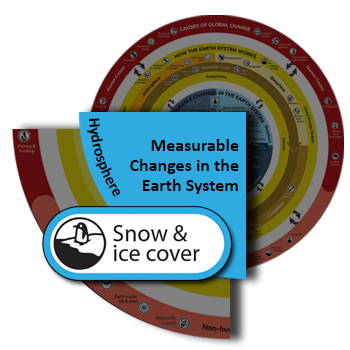
• About
  • Partners
  • Glossary
  • Email
  • Twitter

Understanding Global Change

Discover why the climate and environment changes, your place in the Earth system, and paths to a resilient future.

Understanding Global Change

Discover why the climate and environment changes, your place in the Earth system, and paths to a resilient future.

Menu
  • Home
  • How to use this website
  • What is Global Change?
    • Close
    • Understanding Global Change 101
    • Understanding Global Change Infographic
    • How the Earth System Works
      • Atmosphere
      • Biosphere
      • Elemental Cycles
      • Geosphere
      • Global Energy Budget
      • Hydrosphere
    • Causes of Global Change
      • Human causes
      • Non-human causes
    • Measurable Changes
      • Atmosphere
      • Biosphere
      • Geosphere
      • Hydrosphere
      • Quality of human life
      • Weather / extreme events
    • Close
  • Teaching Resources
    • Close
    • Planning for Instruction
    • Example Units and Lessons
    • Downloadable Graphics
      • Infographic
      • Icon Sets
      • Earth Scene
    • Close
  • Construct a Model
Home → What is Global Change → Measurable Changes in the Earth System → Hydrosphere

Hydrosphere

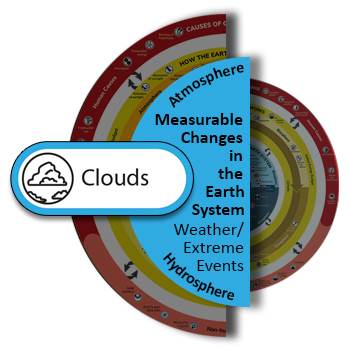
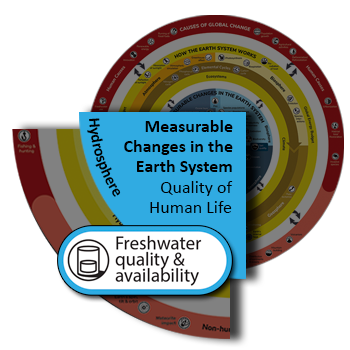
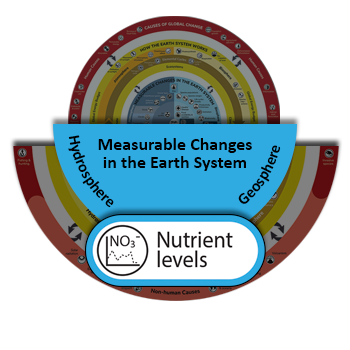
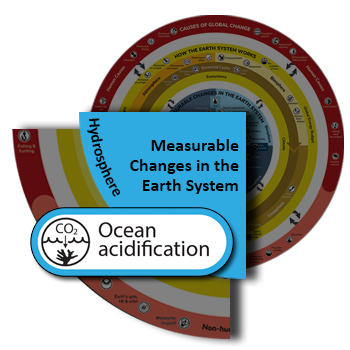
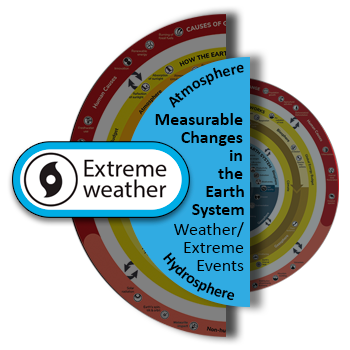
Click the icons below to learn more about measurable changes related to water and ice. Each page contains links to information about related topics on the UGC Infographic. Return to the Measurable Changes page to explore additional global changes.

  • All
  • Atmosphere
  • Biosphere
  • Geosphere
  • Hydrosphere
  • Quality of human life
  • Weather / extreme events

UGC infographic that highlights clouds as a measurable change in the Earth system. Click to see full infographic.

Clouds

UGC infographic that highlights freshwater quality and availability as measurable changes in the Earth system. Click to see full infographic.

Freshwater quality and availability

UGC infographic that highlights nutrient levels as measurable changes in the Earth system. Click to see full infographic.

Nutrient levels

UGC infographic that highlights ocean acidification as a measurable change in the Earth system. Click to see full infographic.

Ocean acidification

UGC infographic that highlights oxygen levels as measurable changes in the Earth system. Click to see full infographic.

Oxygen levels

UGC infographic that highlights precipitation as a measurable change in the Earth system. Click to see full infographic.

Precipitation

UGC infographic that highlights sea level rise as a measurable change in the Earth system. Click to see full infographic.

Sea level rise

UGC infographic that highlights temperature as a measurable change in the Earth system. Click to see full infographic.

Temperature

UGC infographic that highlights snow and ice cover as measurable changes in the Earth system. Click to see full infographic.

Snow & ice cover

UGC infographic that highlights extreme weather as a measurable change in the Earth system. Click to see full infographic.

Weather / Extreme events

A project of the University of California Museum of Paleontology  |  © 2026 University of California Regents. All Rights Reserved.