On this page:
UGC Earth Systems Teaching Tools
It is challenging to represent the complex interactions and feedbacks that explain the causes and consequences of global change. The Understanding Global Change (UGC) Earth System Tools help learners of all ages connect interdisciplinary science ideas and make their thinking about global change phenomena visible. These materials have been integrated into biology, physics, chemistry, Earth science, and integrated science curricula. To see examples of units and lessons, please visit the Units and Lessons Page.
Tips for constructing Earth system models
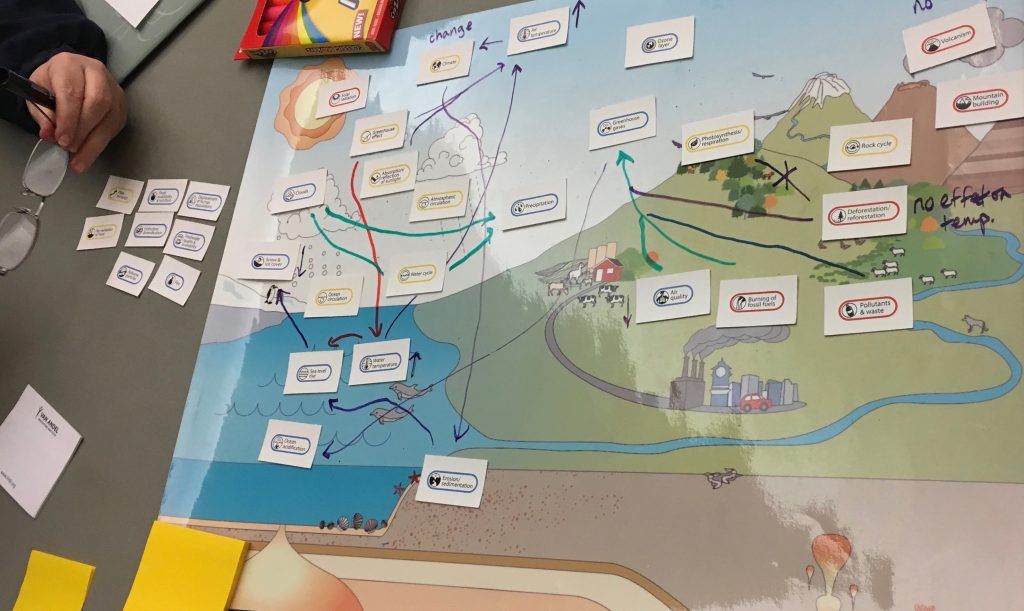
UGC provides tools for constructing explanatory Earth system models that can be used for various in-person and online learning experiences. The UGC Earth Scene represents many parts of the world, and serves as a background for the construction of explanatory models. The UGC Infographic Icons, placed on the Earth Scene, can then be connected with arrows to communicate cause and effect relationships in the Earth system.
Modeling can happen throughout instruction! Learners should gather evidence through various activities to write explanations of the relationships depicted in their models. Students should also have opportunities to test and revise their models as they deepen their knowledge of the causes, consequences, and solutions to global change.
Earth system models can be constructed using printed and laminated copies of the UGC icons and Earth scene and dry-erase markers (as seen on the right). Alternatively, you could use another background image to represent a specific ecosystem or local environment, such as a photo of your school yard or neighborhood park.
Additionally, you can construct digital Earth system models in the UGC Interactive, co-developed with HHMI BioInteractive. The UGC Interactive allows users to save, edit, and export Earth system models and annotations into PowerPoint files.

Additional Teaching Tips:
- Start with no more than 3-4 icons.
- Have students write explanations of connections on sticky notes as they draw arrows.
- There might be multiple ways to accurately represent system connections. It is helpful to keep track of alternative connections since students might construct similar models.
- More instructions and ideas for classroom activities can be found in the Instructional Planning Guide below.
Teaching with the UGC Infographic
 The UGC Infographic is a flexible, adaptable tool that can be used in various ways. Below are tips recommended by educators based on classroom experiences and professional development workshops.
- Connect Content to Global Change: Core science content can be explored through the “lens” of global change. Many of the topics in the NGSS Standards are represented on the UGC Infographic. To explore these connections, download the UGC-NGSS Crosswalk.
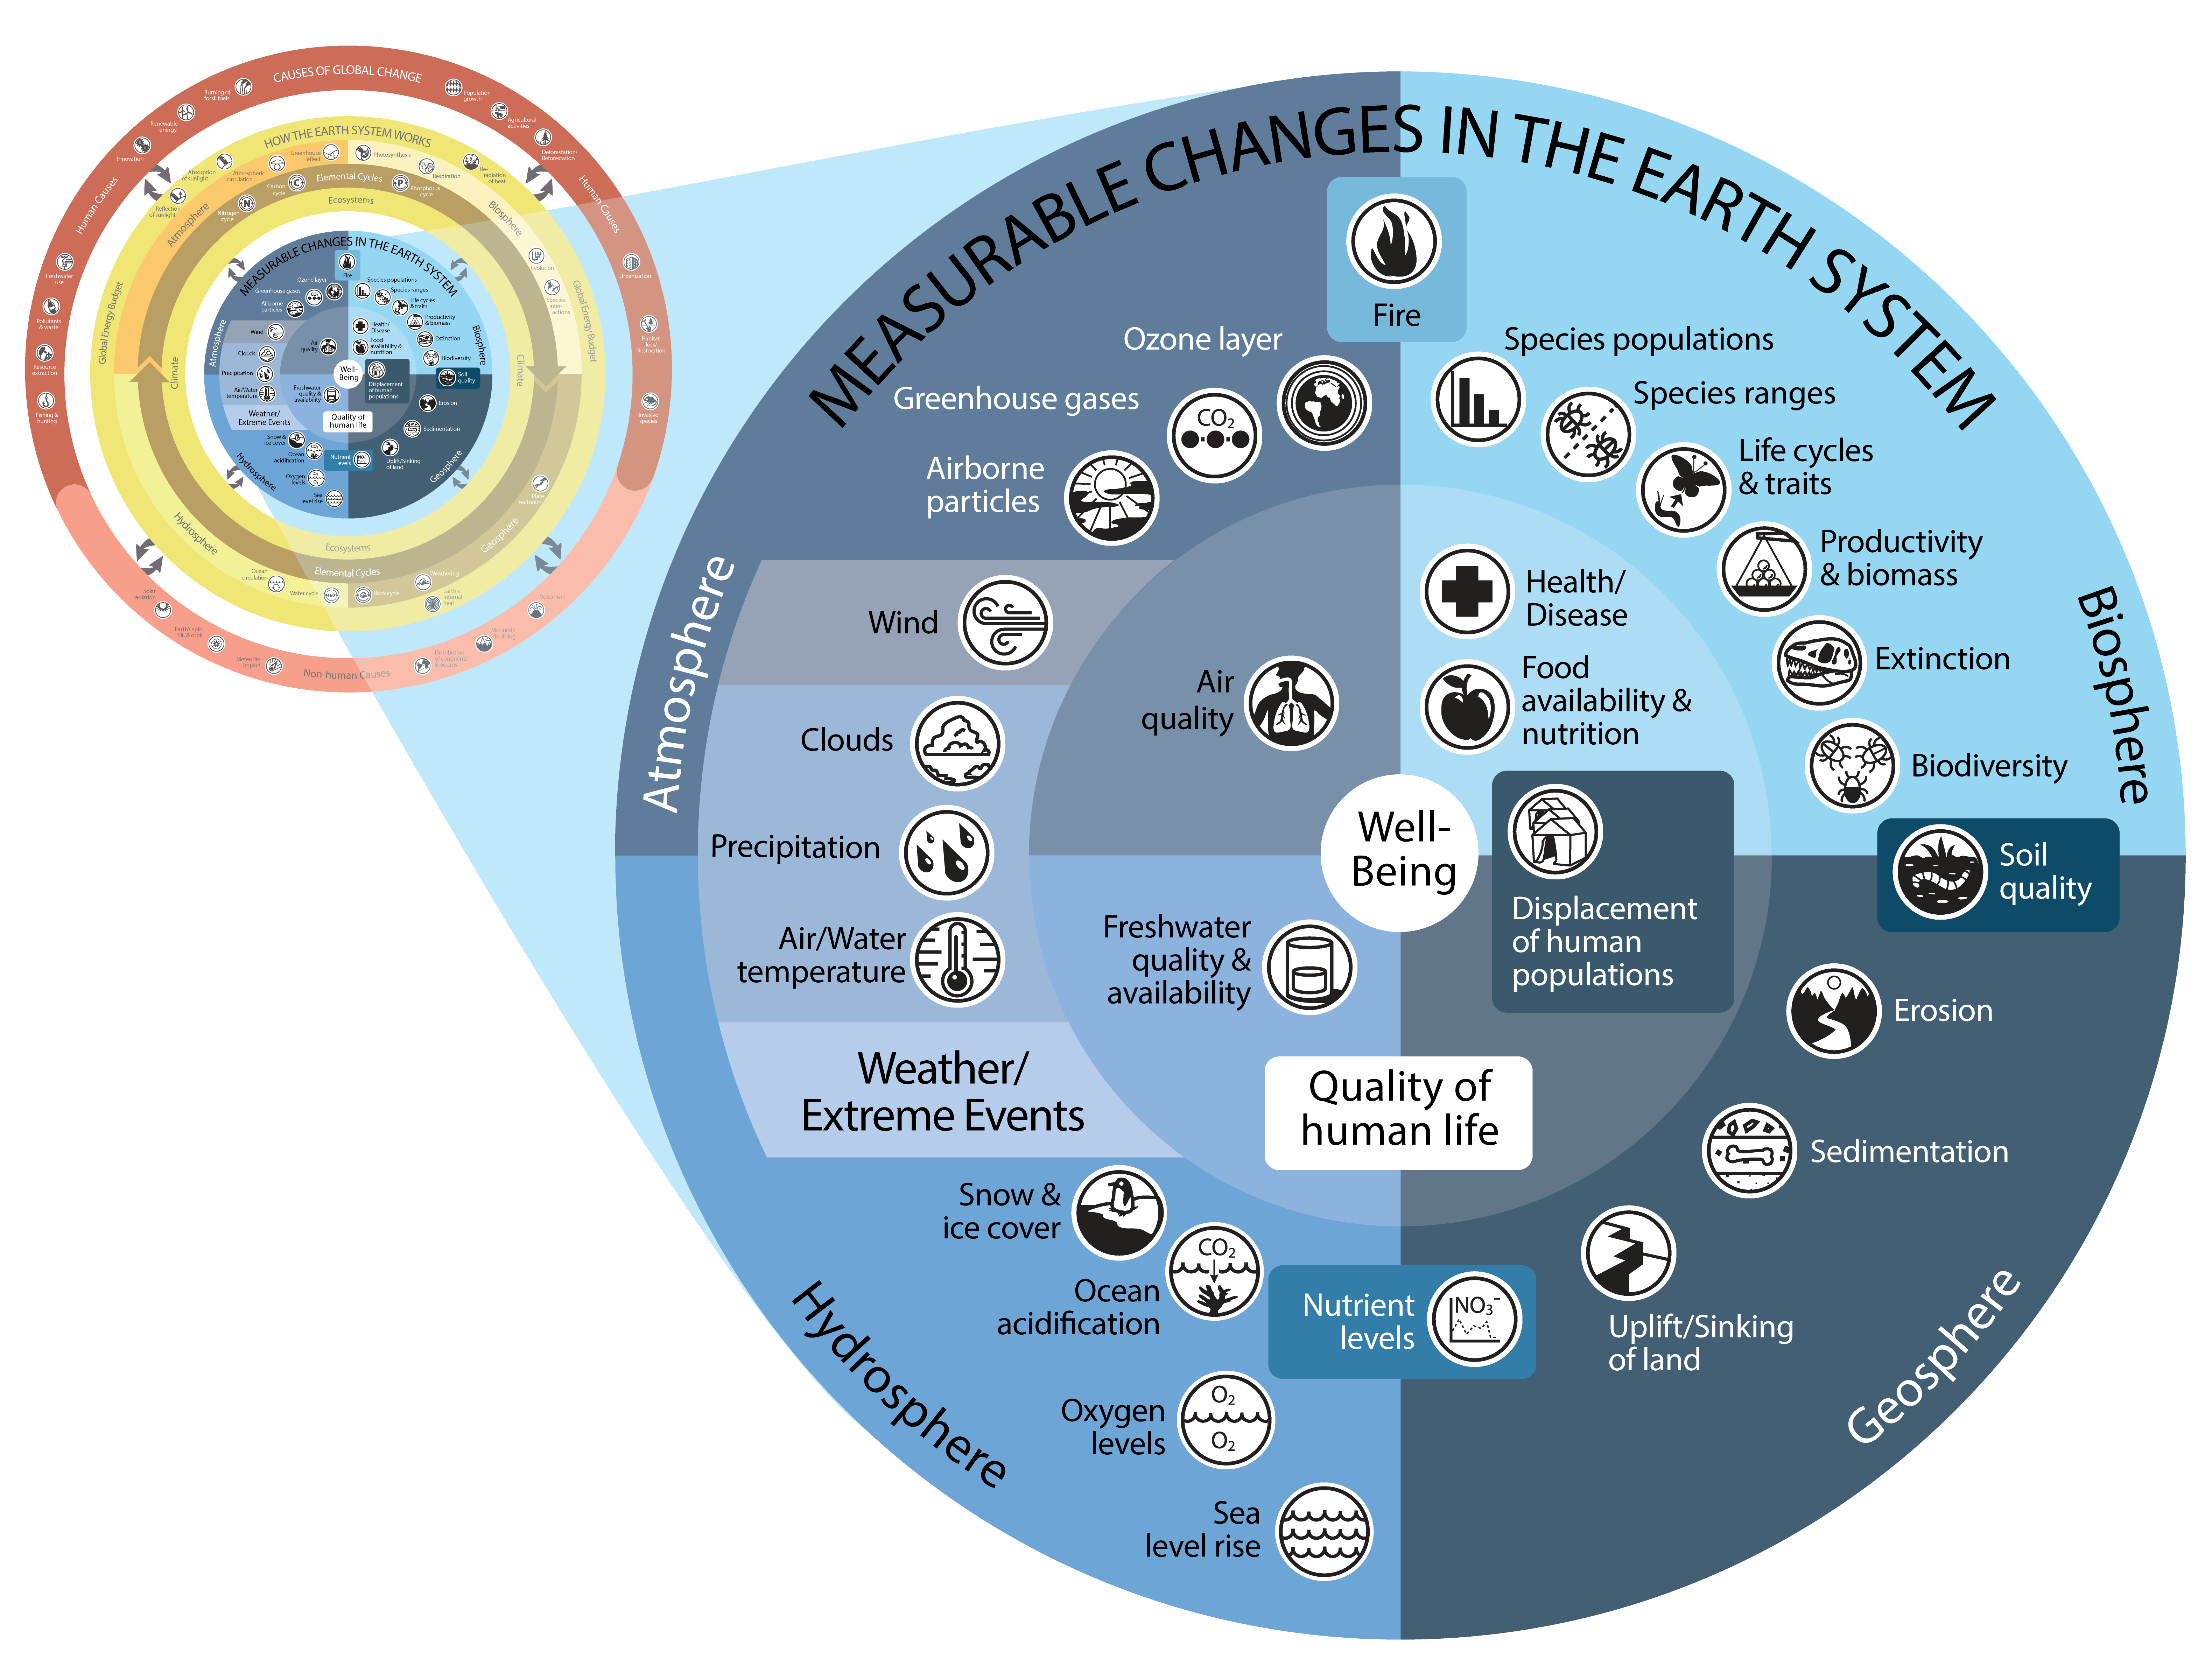
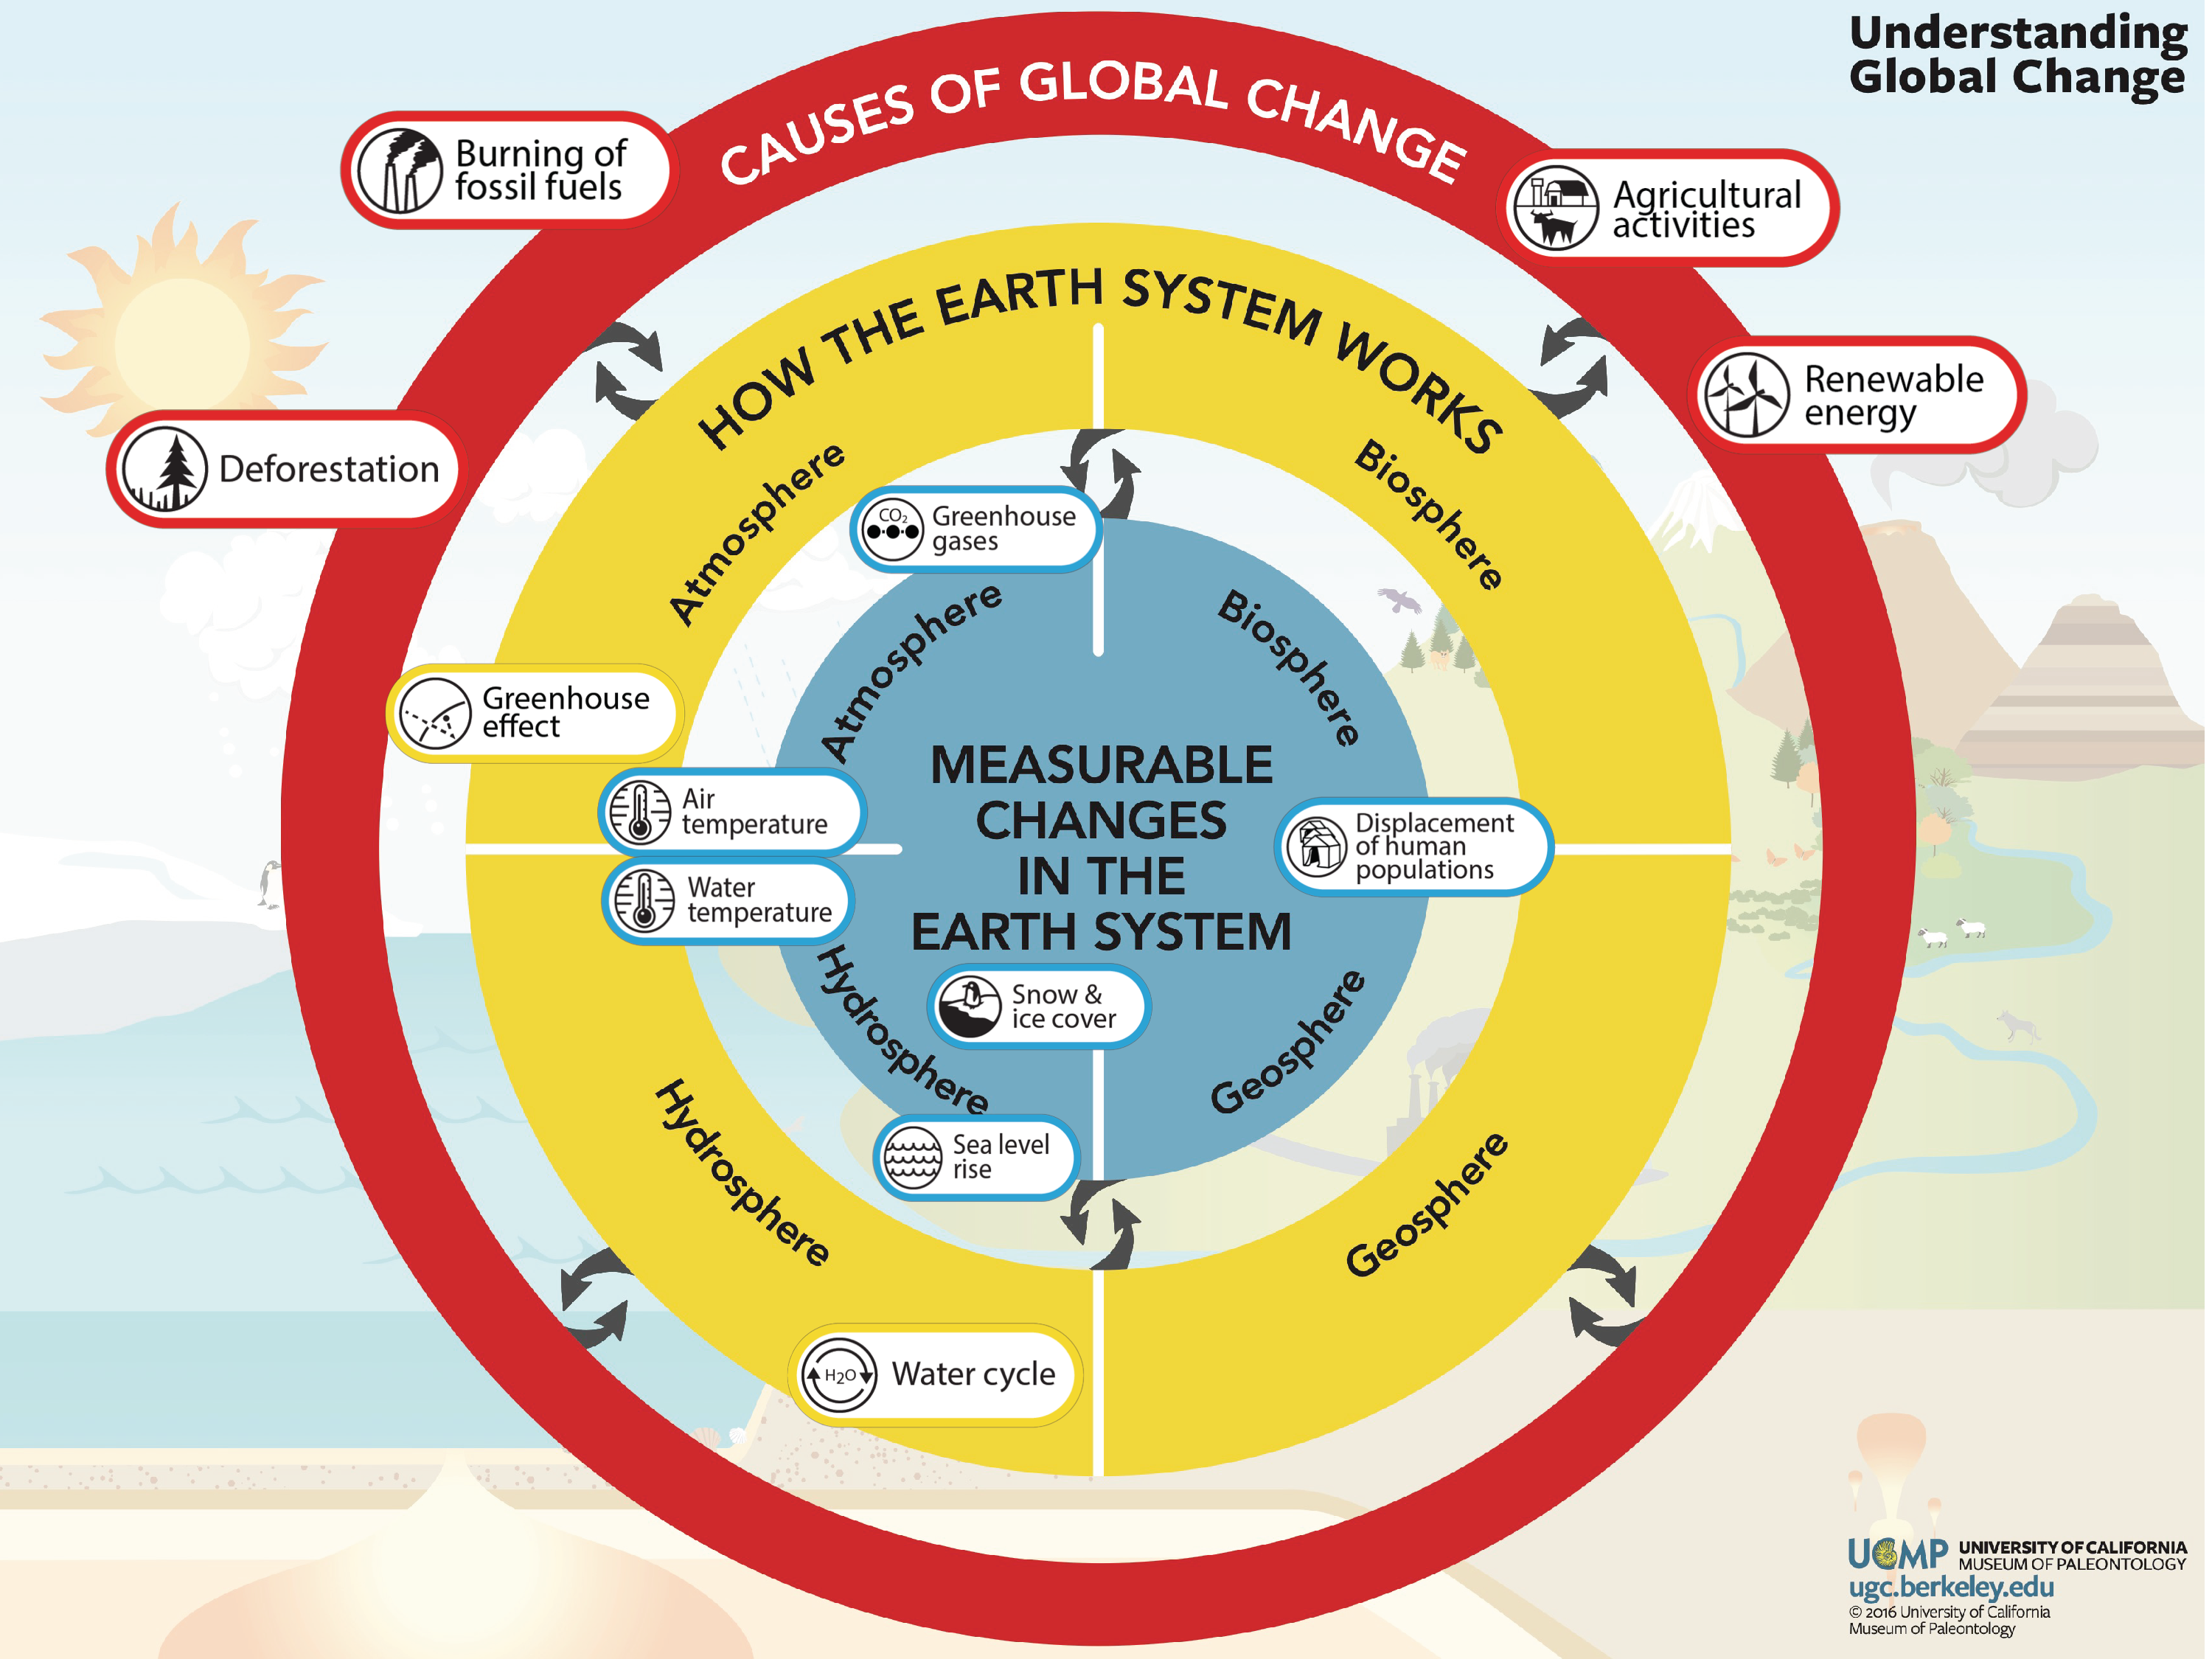
- Use Measurable Changes as Phenomena: To support the implementation of the Next Generation Science Standards and research-based teaching practices, learning should require students to construct explanations and make predictions about how and why the world changes over time. For these reasons, learning should be contextualized using focal phenomena (also called anchoring phenomena). We suggest selecting anchoring phenomena that are UGC Measurable Changes, because these are the observable and quantifiable changes in the Earth system that motivate scientific inquiry (e.g., flooding from sea level rise, or increasing temperatures and greenhouse gas levels). Explaining the causes, consequences, and solutions to measurable changes requires synthesizing concepts from all three major sections of the UGC Infographic (Causes of Global Change, How the Earth System Works, and Measurable Changes pages). For example phenomena, please visit the Units and Lessons Page.

The “simple” UGC Infographic can be used as a word wall, where icons are added as students explore new topics. The Infographic above contains some of the icons relevant to understanding sea level rise.
- Identify Locally Relevant Topics: The infographic topics (e.g., water availability) are relevant to changes happening around the world, and we want students to think about Earth system changes that occur in different places at various scales. Students should also have opportunities to think about how these topics connect to their own lives and local environmental changes. Connecting investigations to local issues will motivate and sustain student interest in learning about global change topics. For example, if you are teaching about changes in water availability, investigate local water issues by analyzing and interpreting local freshwater use and precipitation data.
- Start Simple: Start by using the “Simple” UGC Infographic as a graphic organizer or word wall (as seen to the left). Relevant icons can be sequentially added as learners synthesize new ideas from all three categories. Create posters or handouts for your students using the Infographic and PowerPoint Icons files. The “grades 3-5” versions of the infographic and icons use language that is accessible to all learners.
- The Infographic as a Reference Tool: As students become more familiar with the icon topics, they can use the full, complex infographic with all the icons as a reference tool. Some educators have noted that the infographic helps to connect all science learning to global change, and acts as a “periodic table of global change.” As students construct explanations of a measurable change through a series of lessons, they will make connections across all three major sections of the UGC Infographic.
Instructional Planning Guide
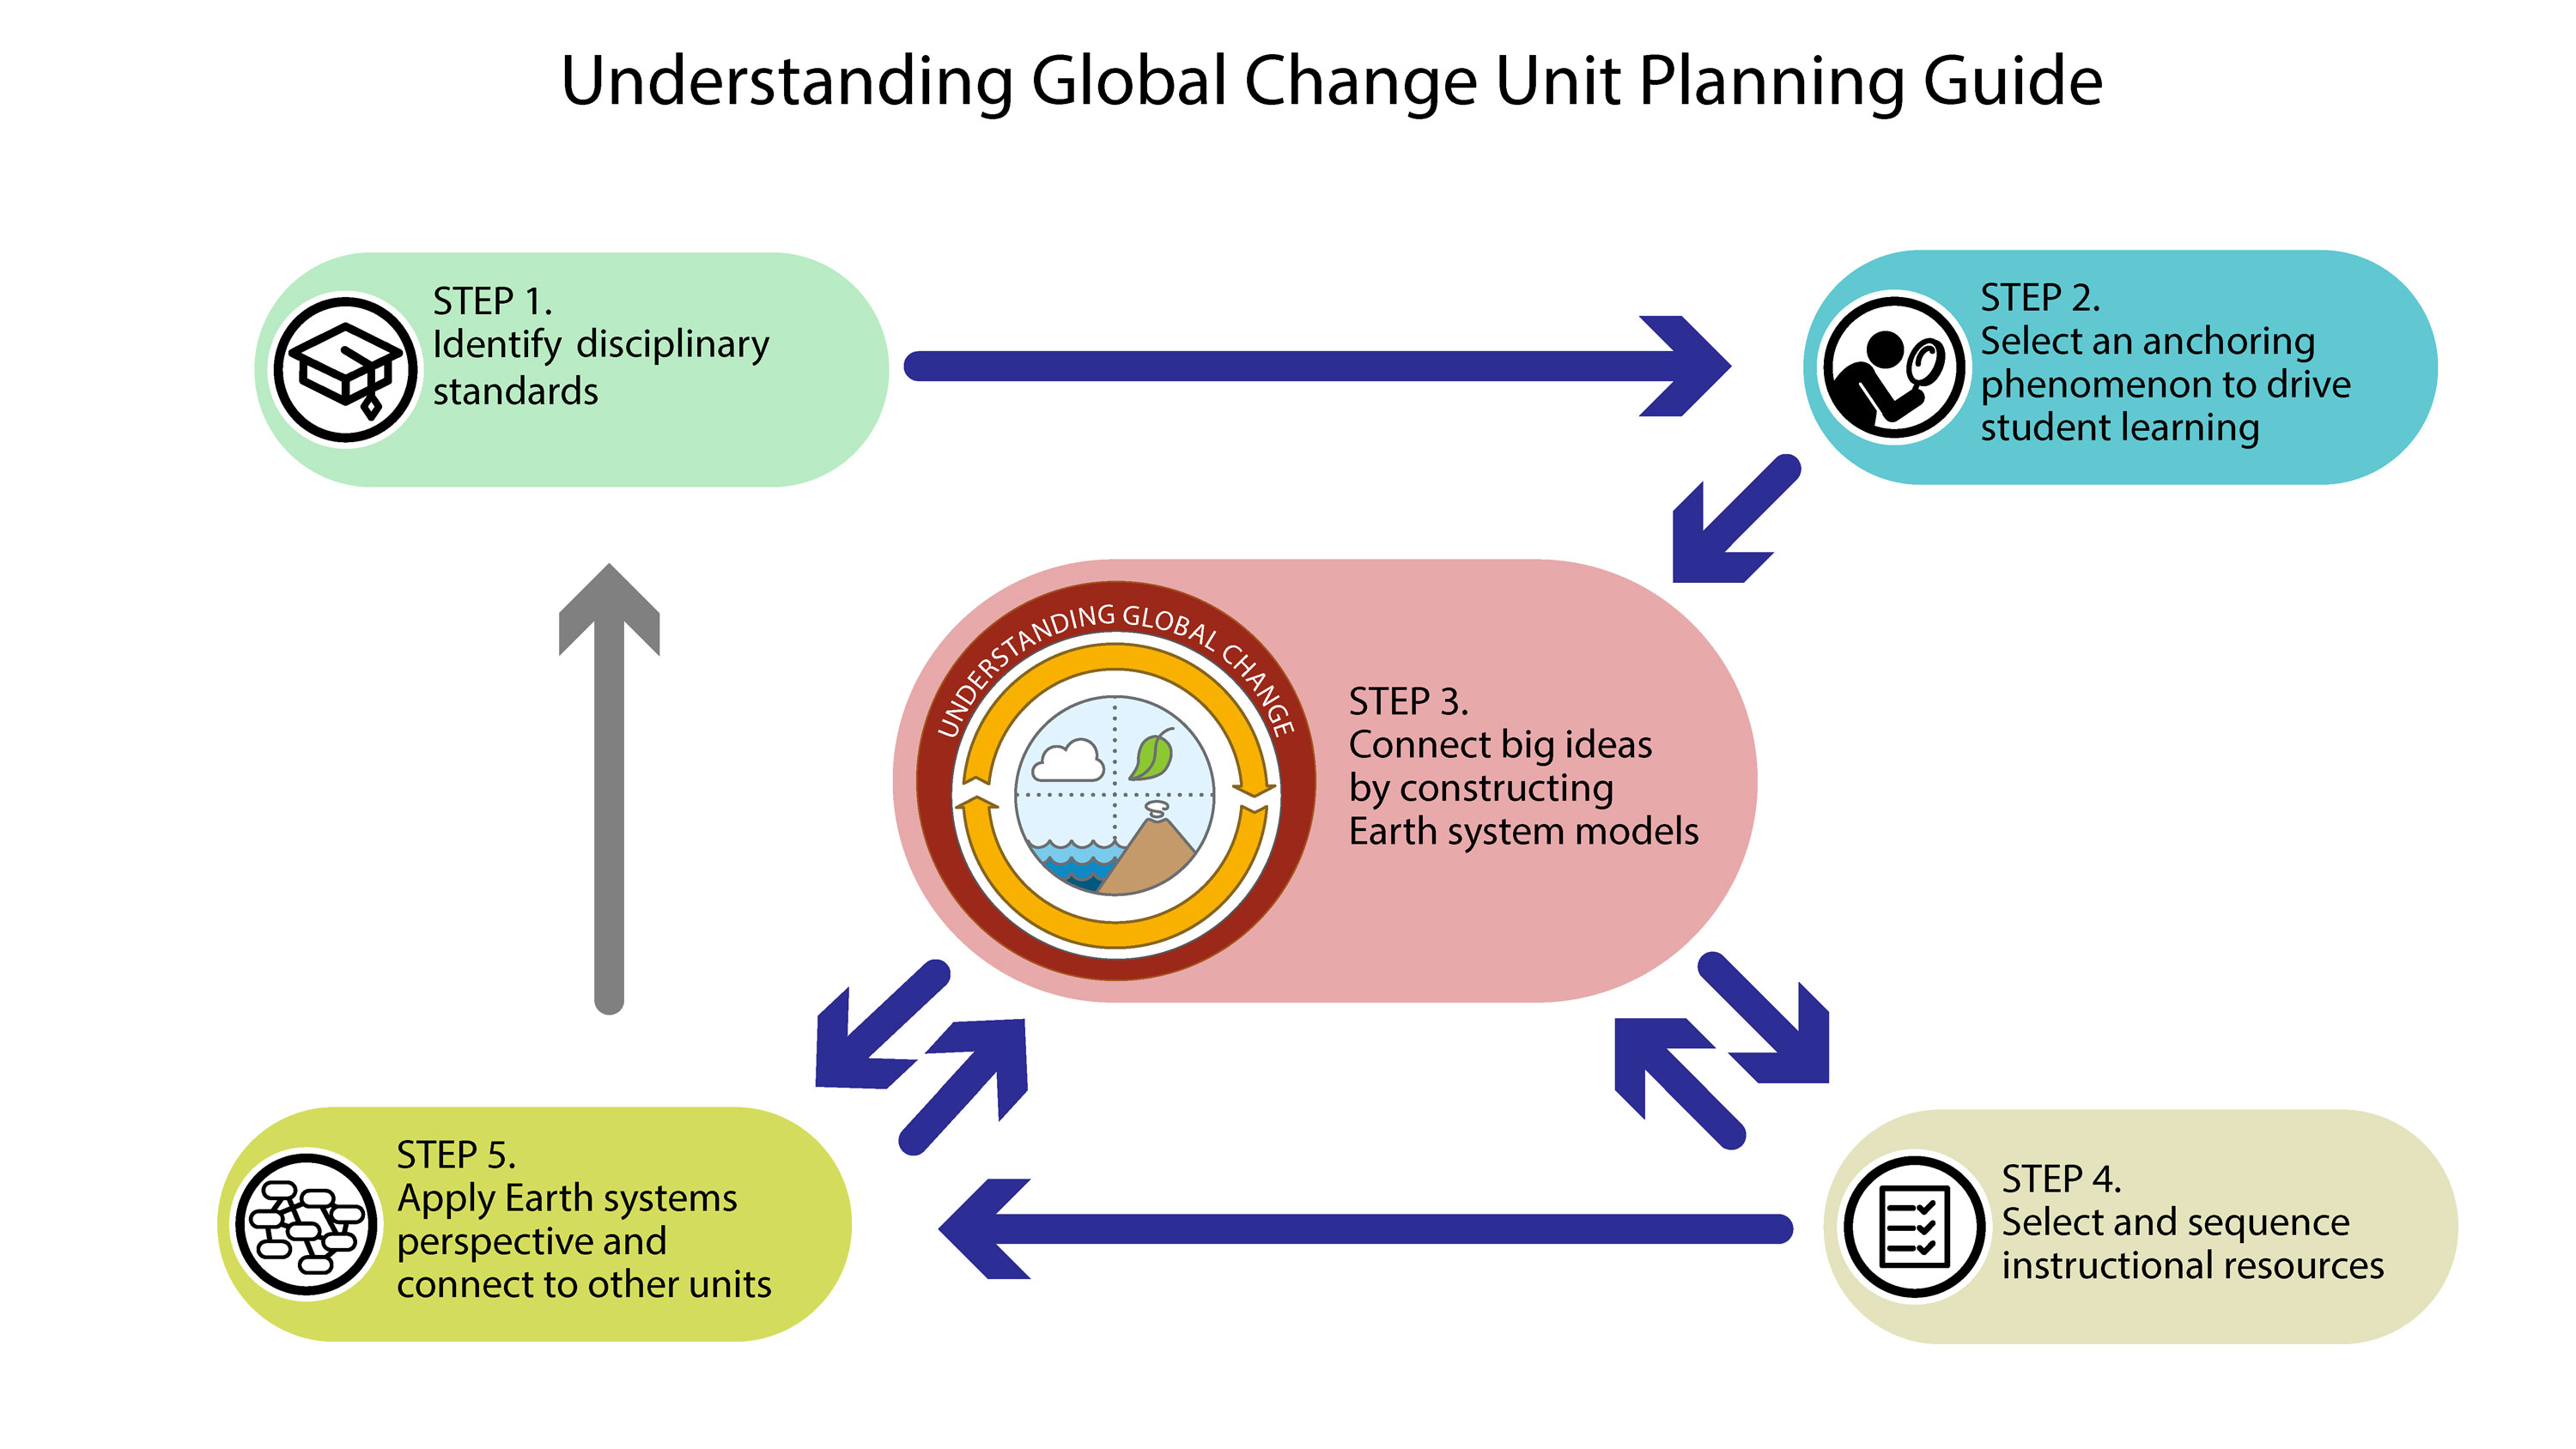
The Understanding Global Change (UGC) Project partnered with Climate Literacy and Energy Awareness Network (CLEAN) educators and classroom teachers to construct a step-by-step planning guide for designing new units or revising existing curricula to enhance students’ thinking about the Earth as a dynamic, interconnected system.
This 5-step guide supports the design and implementation of learning experiences that use the UGC Earth System Modeling Tools, and focuses student learning on anchoring phenomena, which are Measurable (observable) Changes in the Earth system identified in the UGC Infographic (e.g. changes in sea level rise, temperature, species ranges, water quality & availability, etc.).
Download the guide to get started, and use the UGC-NGSS Crosswalk spreadsheet to explore the K-12 standards that are relevant to the topic/ icons in the UGC Framework you plan to teach.

Downloads
To see examples of UGC instructional materials, visit the UGC Units and Lessons Page.
